Hi, I'm Hayeon
I find problems in data, solve them through experimentation,
and connect growth opportunities across the user lifecycle to business impact.
7+
YEARS
MARKETPLACE · B2B · COMMERCE
DOMAIN
GROWTH · FULL-FUNNEL · VALUE CREATION
SPECIALTY

Projects
From provider activation to revenue expansion
The provider journey was losing users before the first quote and plateauing after it. I defined each conversion gap separately and designed experiments and CRM for each stage — building a structure where activation leads to repeat behavior and revenue expansion.
Purchase CVR +43.3% · Quote CVR +32% · Promotion ROAS 1,249%
User acquisition, retention & monetization strategy
At Nextunicorn, the priority was building a structure where acquired users returned and converted to paid actions — not just growing traffic volume. I connected Paid UA, CRM, and SEO into a single growth funnel, linking acquisition, retention, and monetization.
CAC −53% · Repurchase target 101% · Blended ROAS 133%
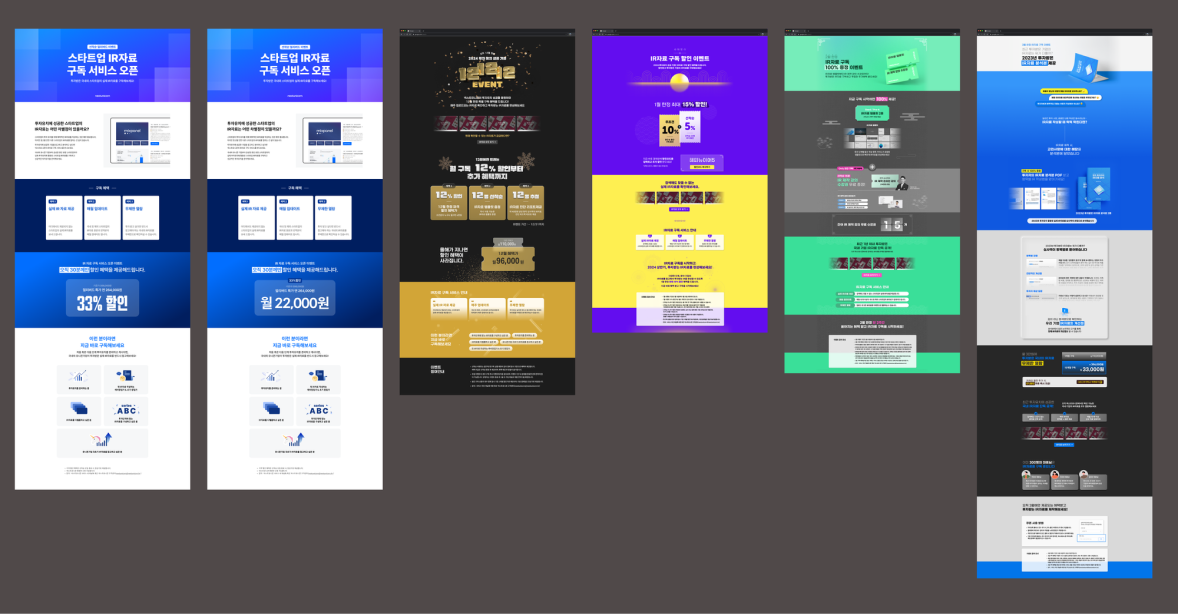
Promotion
프로모션 기획·환경 구축·운영
Promotion
프로모션 기획·환경 구축·운영
Background
1월 파일럿(₩1,300 CPI, BEP 163%)에서 검증된 경품 구조와 채널 조합 효율을 기반으로, 디자인·기획 리소스를 본격 투입하여 진행한 앱 다운로드 캠페인의 메인 실행입니다. 앱 미다운로드 그룹이 웹 전환율은 더 높지만 다운로드 그룹의 인당 요청서 수가 확연히 높다는 점에서, "신규 전환"보다 "리텐션·반복 사용"의 장기 가치(LTV)를 목표로 설계했습니다. 친구톡 외 트래킹 가능 채널 비중 확대와 체스 테마 게임형 IAM으로 참여 경험을 차별화했습니다.
Execution
- 대상: 앱 미설치/삭제 고객
- 체스 테마 게임형 IAM — 약관 동의·푸시 권한 획득 플로우 설계
- Airbridge Deferred Deep Link로 앱 설치 후 프로모션 자동 연결
Result
- CPI ₩443 (경품비 포함, 1월 대비 66% 절감)
- BEP 대비 409% · AMBITIOUS 시나리오 상회
- iROAS 3,449%
Creative & IAM
↕ 스크롤로 전체 페이지 확인
Background
앱 다운로드 유도 캠페인의 첫 시도(파일럿)로, 유저 접속 시 인앱 모달만 노출하는 최소 스펙으로 진행했습니다. 별도 이벤트 페이지·랜딩 없이, 경품 구조의 유효성과 채널 조합(친구톡 + 인앱 모달 + 앱 푸시)의 전환 효율을 검증하는 것이 목표였습니다. 본격 리소스를 투입하는 3월 본 프로모션에 앞서, 인앱 모달 단독으로도 BEP 달성이 가능한지 확인하기 위한 단계입니다.
Execution
- 대상: 앱 미설치/삭제 고객 (2025년 이후 가입자)
- 친구톡 6차 + 인앱 모달 4종 자동 운영
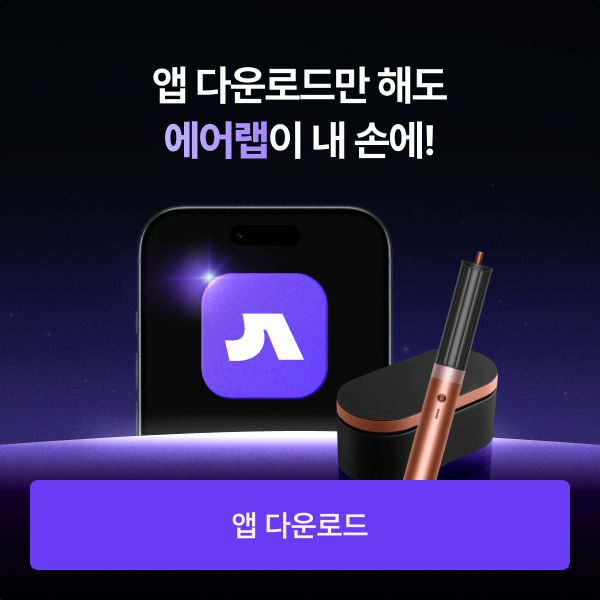
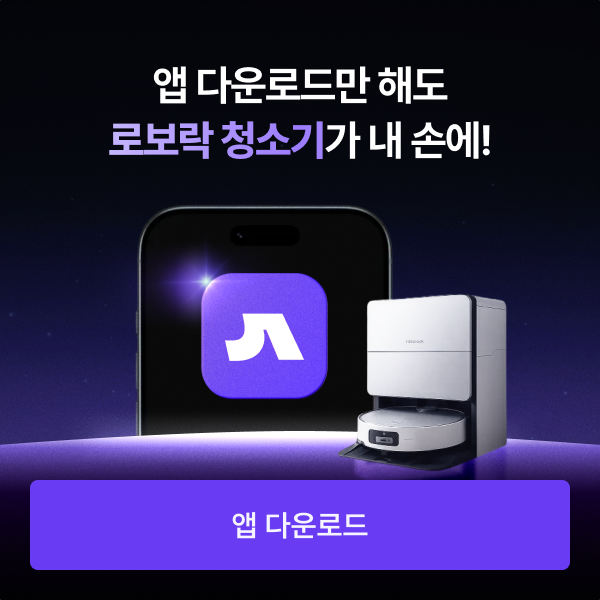
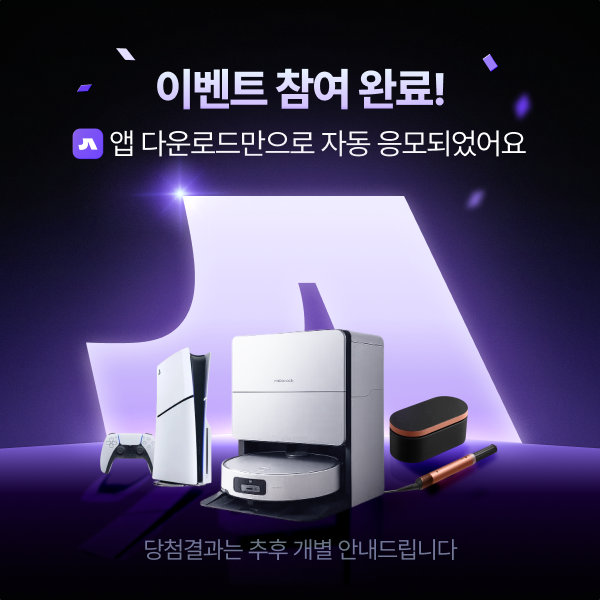
- 경품: PS5 / 다이슨 에어랩 / 로보락 청소기 — 다운로드 자동 응모
- 주차별 세그먼트 고도화로 Direct CVR 0.04% → 0.57%까지 학습
- 플로우: 상품 모달 → 앱스토어 → 다운로드 → Airbridge 트래킹 매칭 → 응모 완료 모달 자동 노출
Result
- CPI ₩1,300 (경품비 포함)
- BEP 대비 163%
- iROAS 1,176%
Creative — 인앱 모달
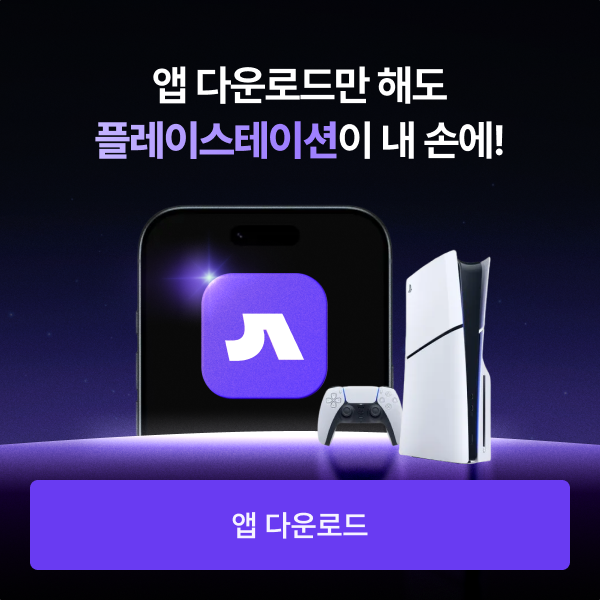
PS5 — 다운로드 유도 IAM
Background
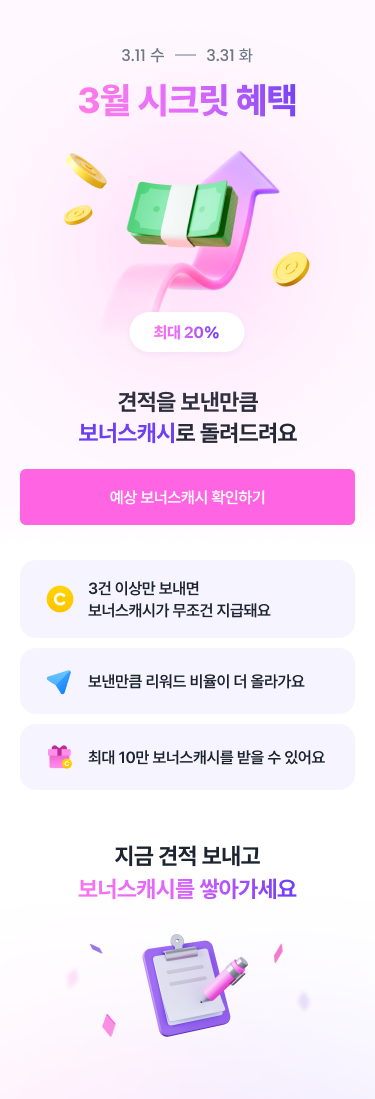
요청서 대비 견적 비율이 낮아지는 시기를 대비해 견적 발송 행동을 증폭시키는 캐시백 구조를 설계했습니다. 고활성 고수의 데드웨이트를 통제하고 실질 행동 변화 구간에 인센티브를 집중하는 것이 핵심 과제였습니다.
Execution
- BigQuery로 카테고리별 구간별 고수 인원 추출 (이사/청소·과외·외주·도배장판)
- 구간별 이동률 가정 + 반응함수 기반 iROAS 시뮬레이터 직접 설계
- 캐시백 구조: 3건+ 구간차등(3~20%), 30건 Cap, 10+구간 제외로 데드웨이트 통제
- HTML 인터랙티브 예산 대시보드로 보수/낙관 시나리오 비교 보고
Result
- 견적 발송 고수당 견적 수 +82.0% — 캐시백이 실질 행동 변화를 만든 핵심 지표
- iROAS 236% (전체 기간, 프로모션 리워드 기준)
Creative & IAM
↕ 스크롤로 전체 페이지 확인
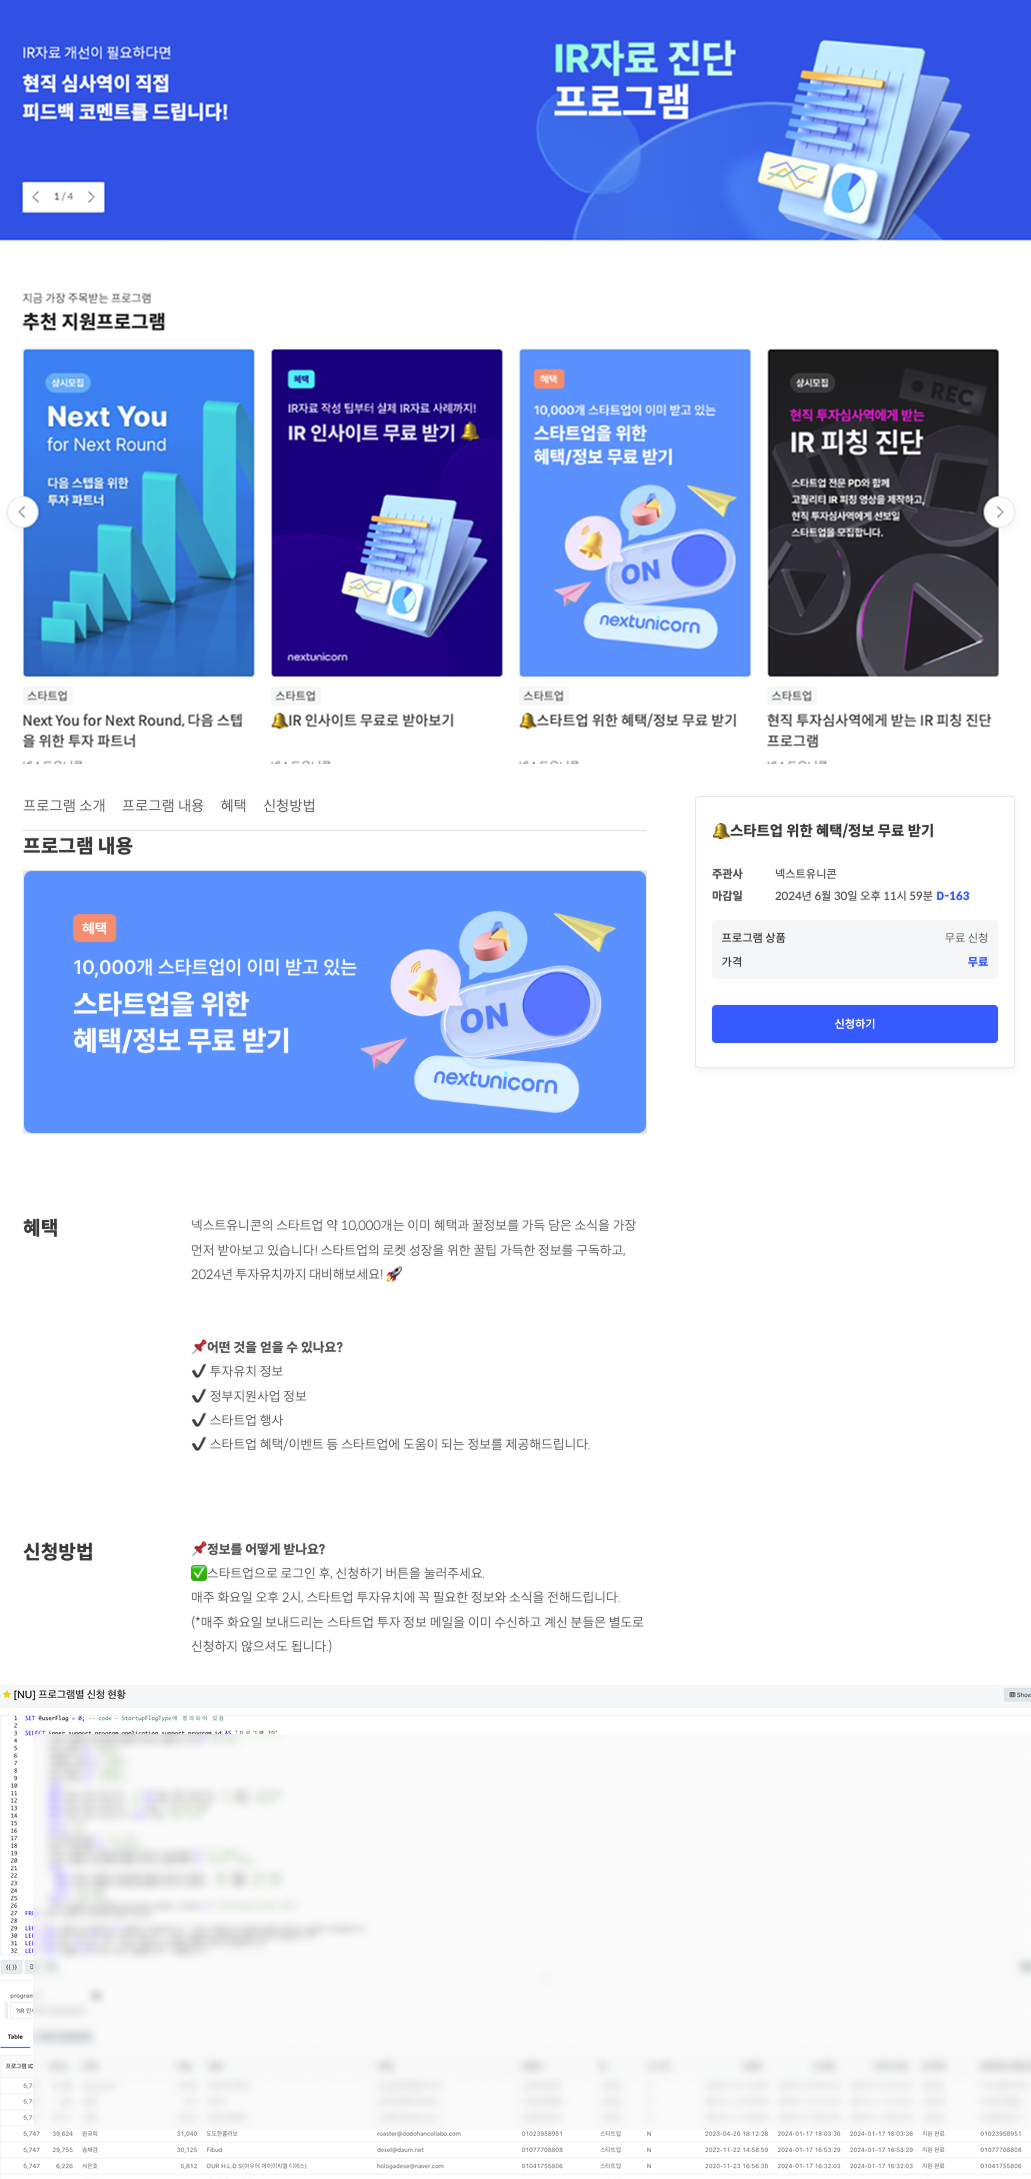
Overview
Nextunicorn에서 IR자료 구독 서비스 전환을 목표로 월별 프로모션을 기획·운영했습니다. 할인 구조·이벤트 테마·랜딩 페이지 구성을 매월 직접 설계하며 월 매출의 평균 60%를 견인했습니다.
Creative
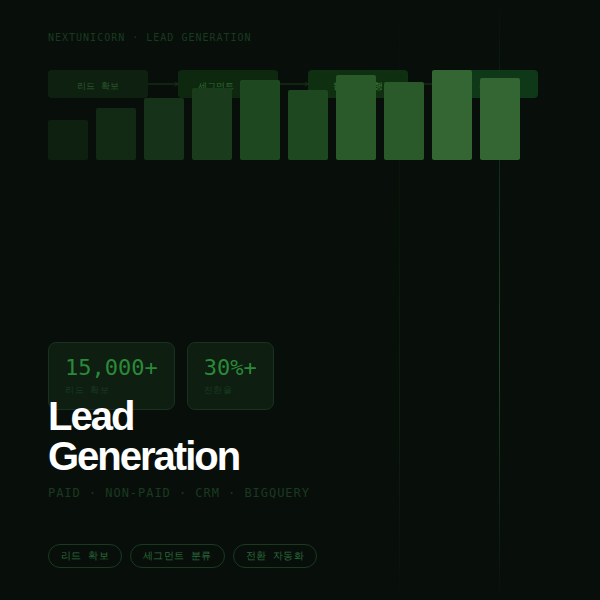
Lead Generation
리드 제너레이션·리드 전환
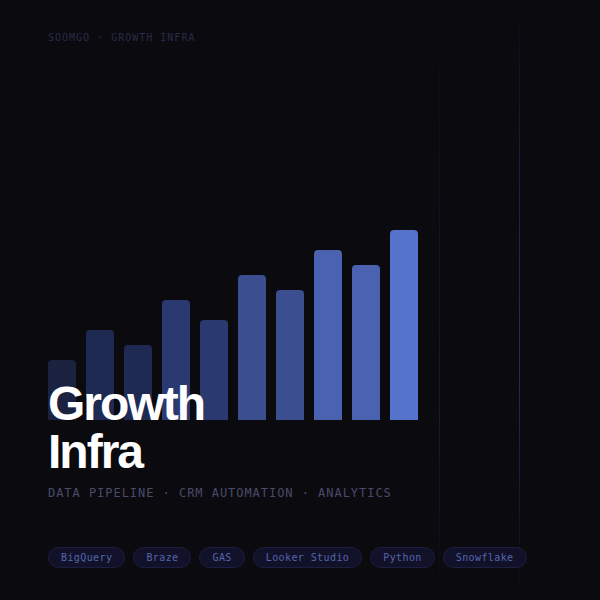
Growth Infra
마케팅 자동화·데이터 파이프라인 구축
Growth Infra
"실험 → 액션 → 검증"의 운영 루프를 자동화 시스템으로
마케팅 실행에는 동일한 작업의 반복이 많습니다. 매일 지표를 들여다보고, 이상 신호를 발견하고, 액션을 실행하고, 효과를 검증하는 사이클이 매번 사람의 손을 거치면 누락·지연·기준 차이가 누적되고, 결국 분석과 실험에 쓸 수 있는 시간이 줄어 실험의 속도가 느려집니다.
BigQuery · n8n · Braze · Google Workspace를 조합해 모니터링부터 액션 검증까지의 운영 사이클을 자동화 가능한 구조로 정비했고, 매일 같은 기준으로 데이터를 보며 의사결정할 수 있는 환경을 만들었습니다.
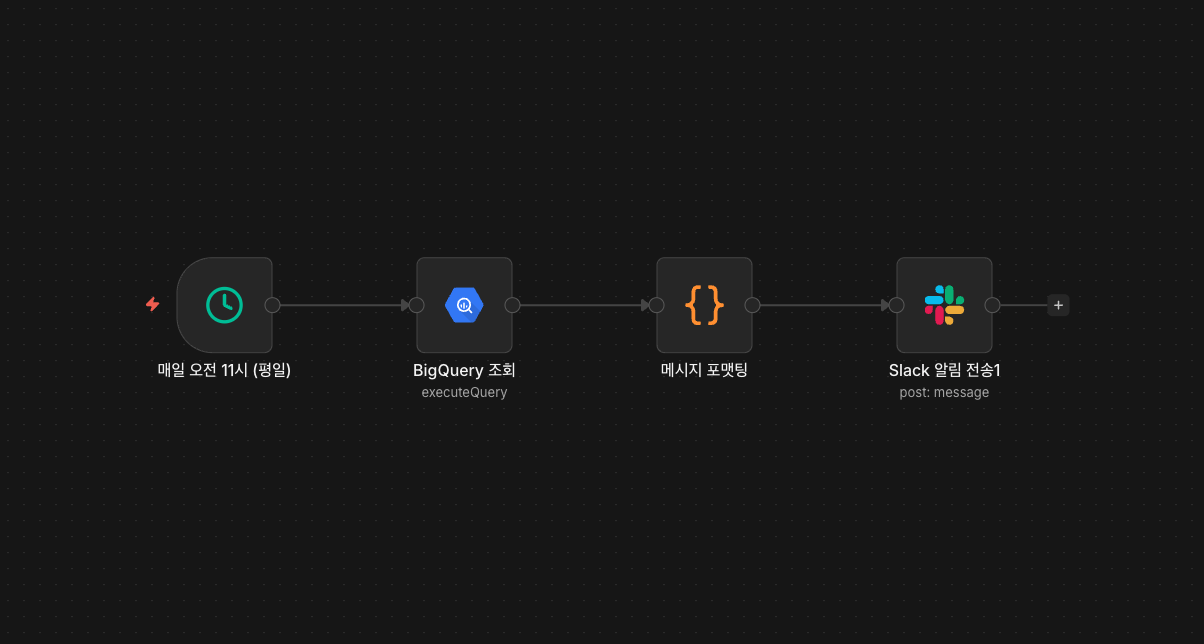
① MONITOR
핵심 지표를 매일 자동으로 추출하고 알림
매일 아침, n8n이 BigQuery에서 지표를 자동 추출해 Slack으로 발송합니다. 같은 시간에 동일한 기준의 리포트가 도착하기 때문에, 마케터는 더 이상 "오늘 어디까지 봐야 하지?"를 고민하지 않고 바로 분석에 들어갑니다.
단순 모니터링을 넘어, BigQuery · Kafka · 클라이언트 이벤트 데이터를 Braze User Attribute로 전송하는 파이프라인까지 함께 기획했습니다. 고수의 스마트견적 캠페인 활성화/비활성화 상태를 실시간으로 Braze에 반영해, 모니터링한 데이터가 곧바로 맞춤형 CRM 세그먼트로 활용될 수 있는 구조를 개발팀·프로덕트팀과 협업해 설계했습니다.
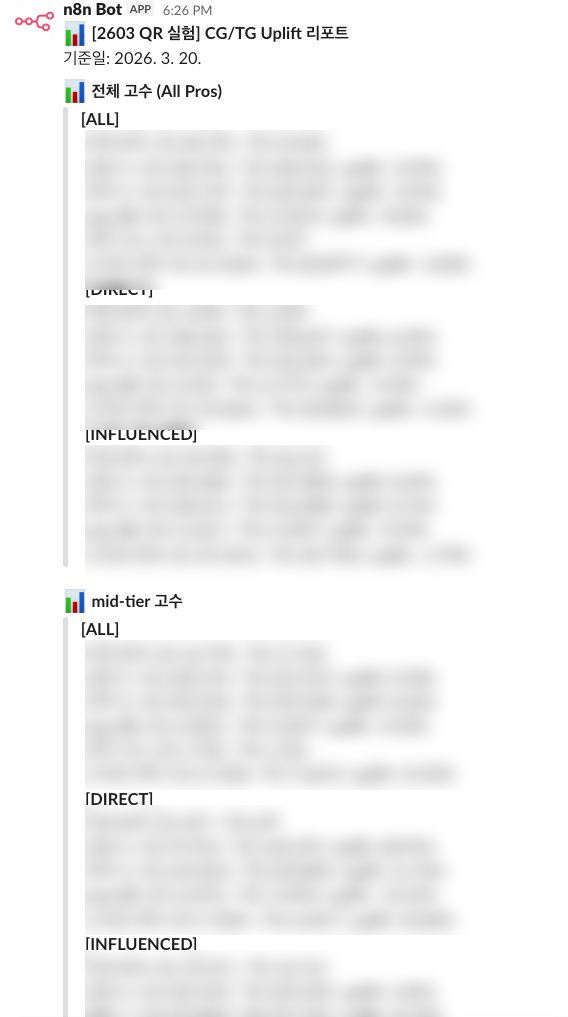
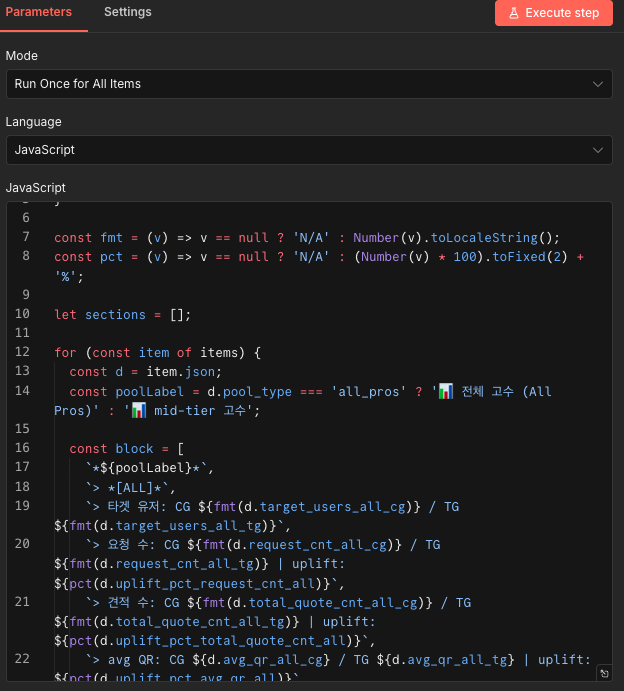
② DETECT
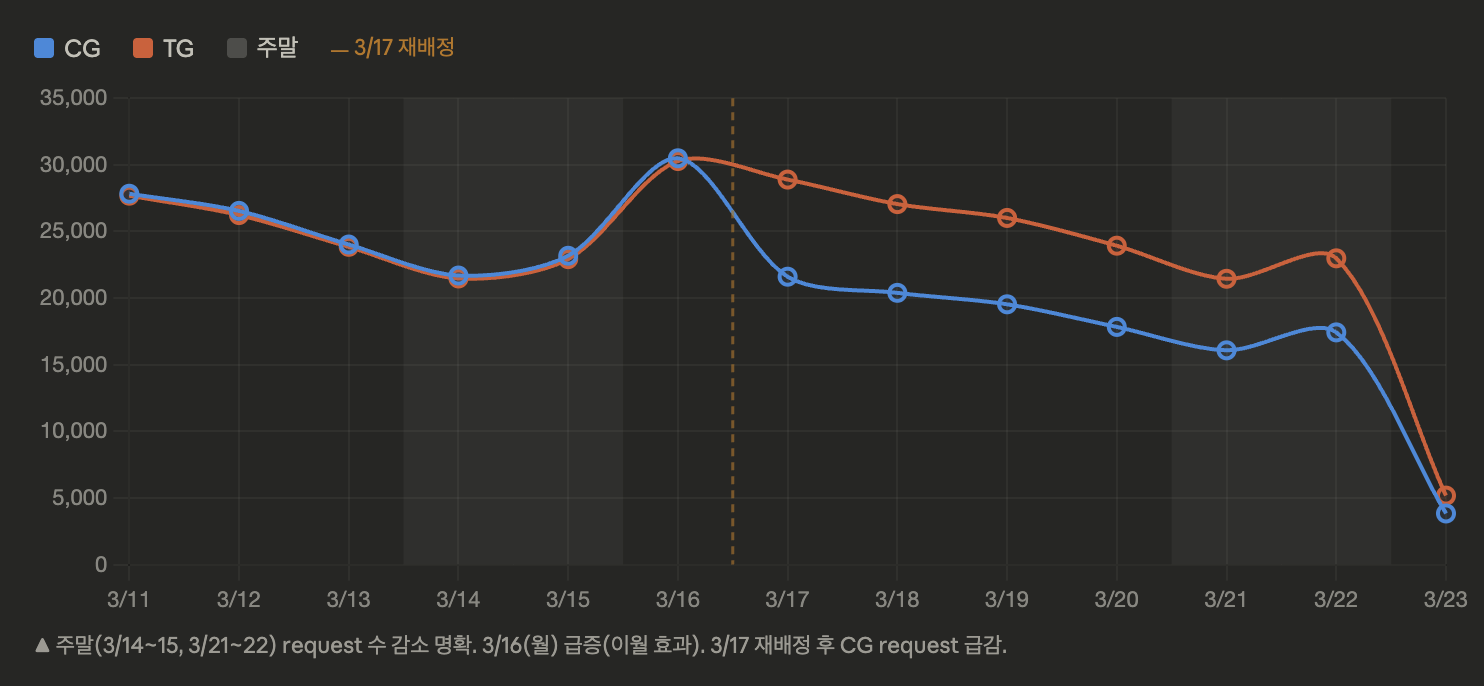
액션이 필요한 세그먼트를 바로 식별하도록 알림
단순 수치 알림이 아니라, 핵심 지표를 세그먼트별 uplift%와 함께 정리해 보여줍니다. 어디서 효과가 나오고 어디서 막혔는지 빠르게 파악해 다음 액션을 결정할 수 있게 합니다. CG/TG 비교, 전체/Direct/Influenced 분리까지 자동으로 정리합니다.
③ SCHEDULE
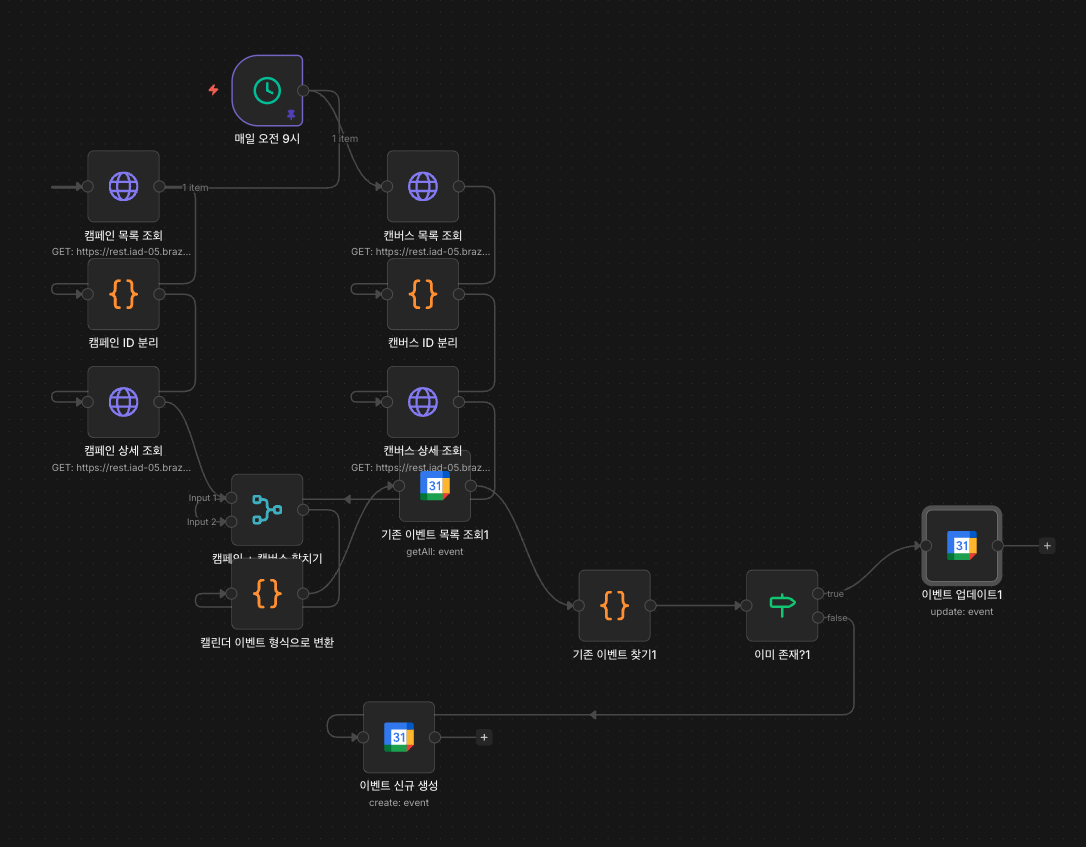
예정·과거 액션을 캘린더로 한눈에
결정된 액션은 Braze 캠페인·캔버스로 등록되고, 동일 워크플로우가 매일 오전 이를 Google Calendar 이벤트로 자동 동기화합니다. 예정·진행 중·완료된 액션이 같은 뷰에서 한눈에 보이기 때문에 팀 간 일정 공유가 쉬워지고 캠페인 충돌도 자연스럽게 방지됩니다.
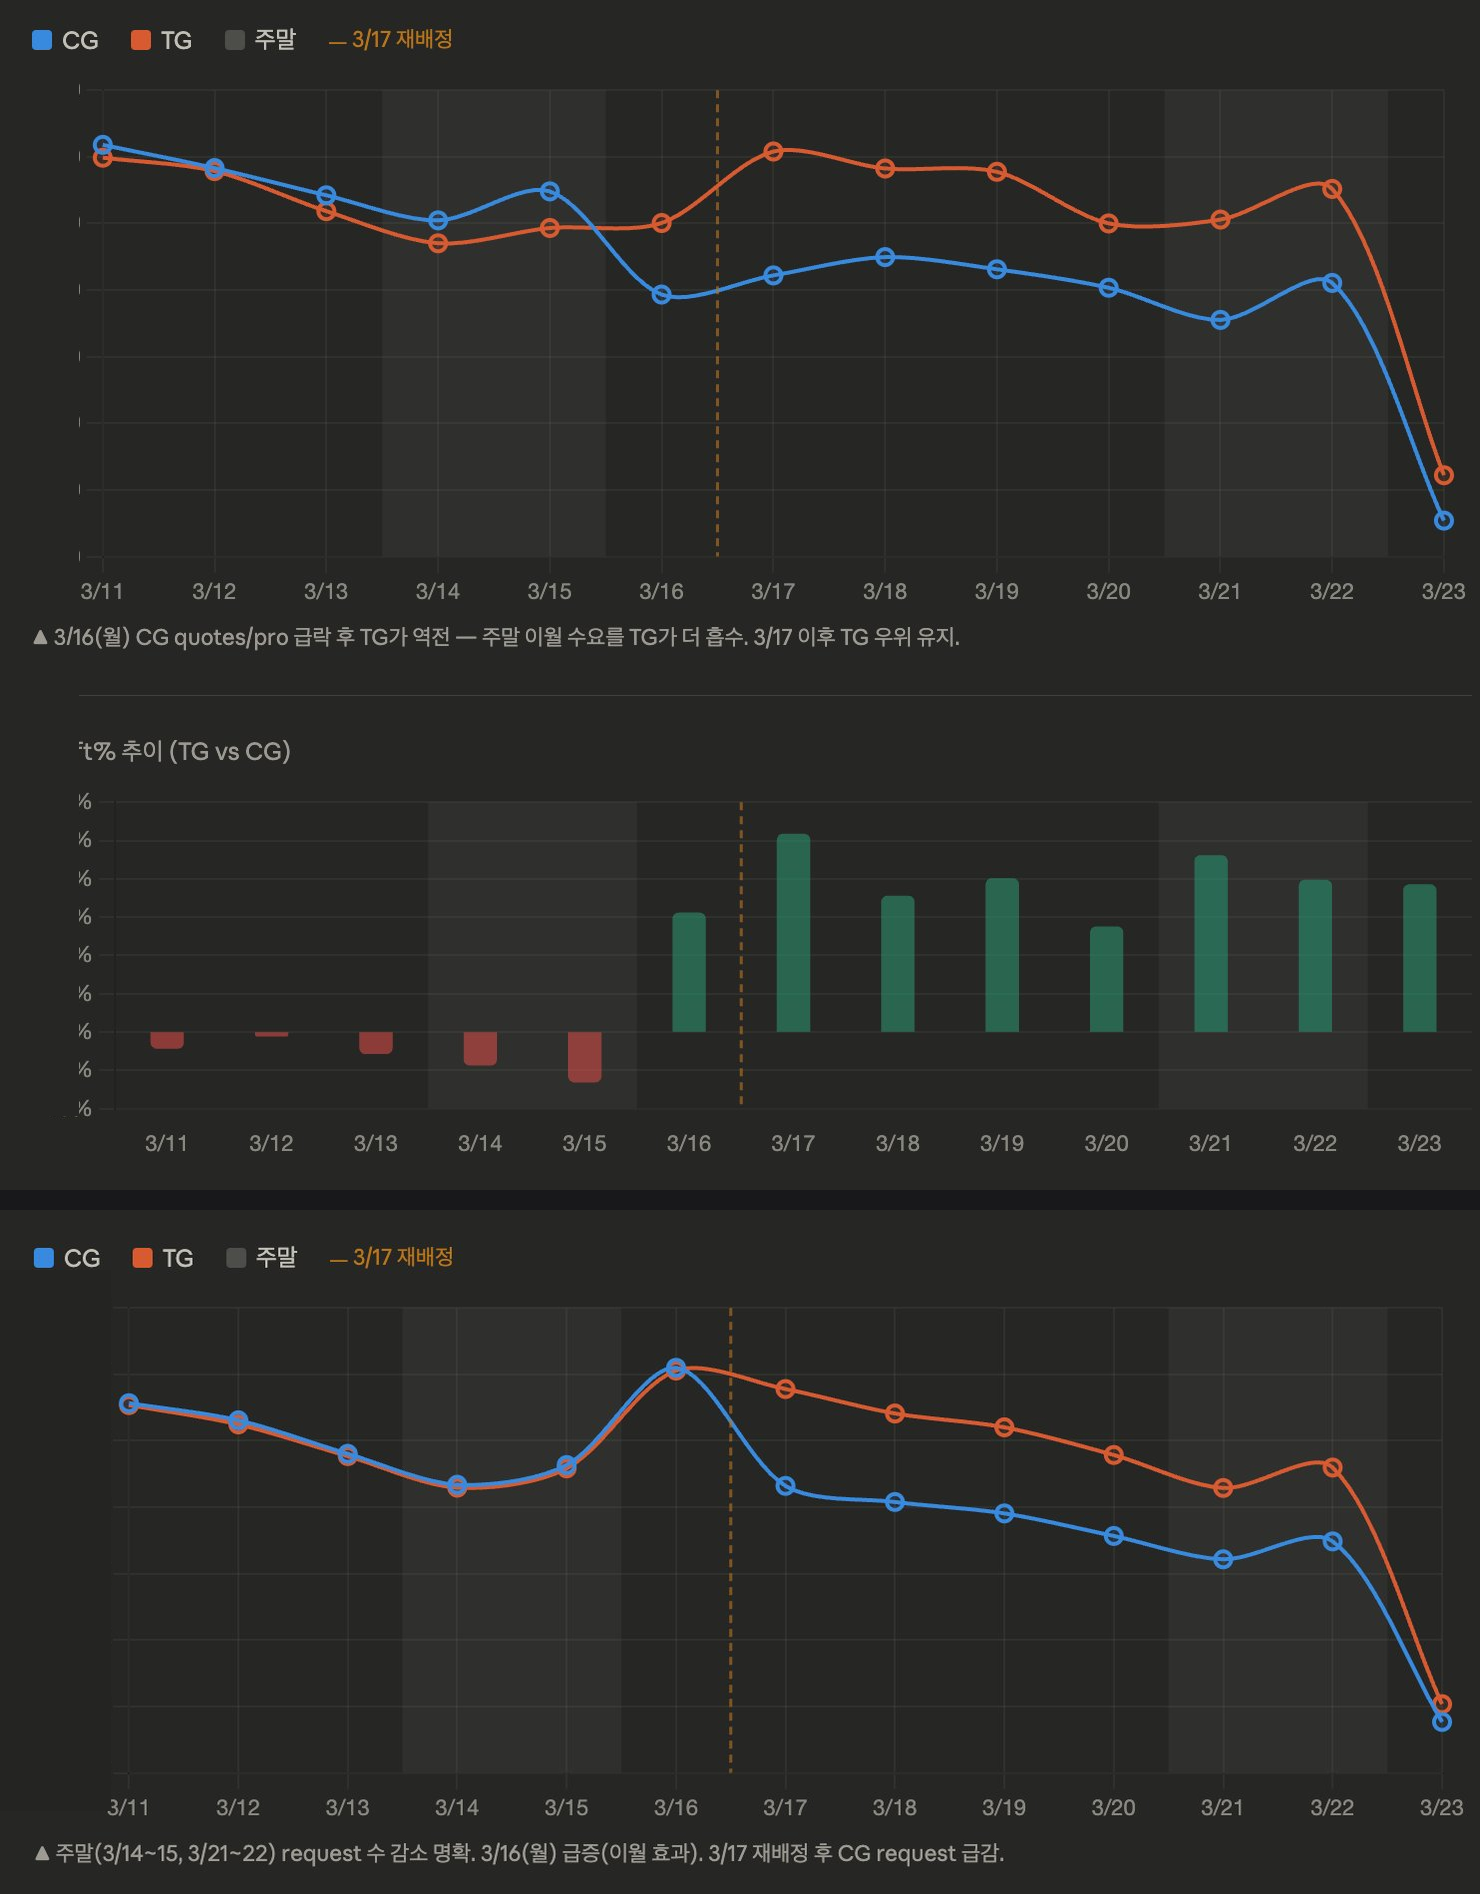
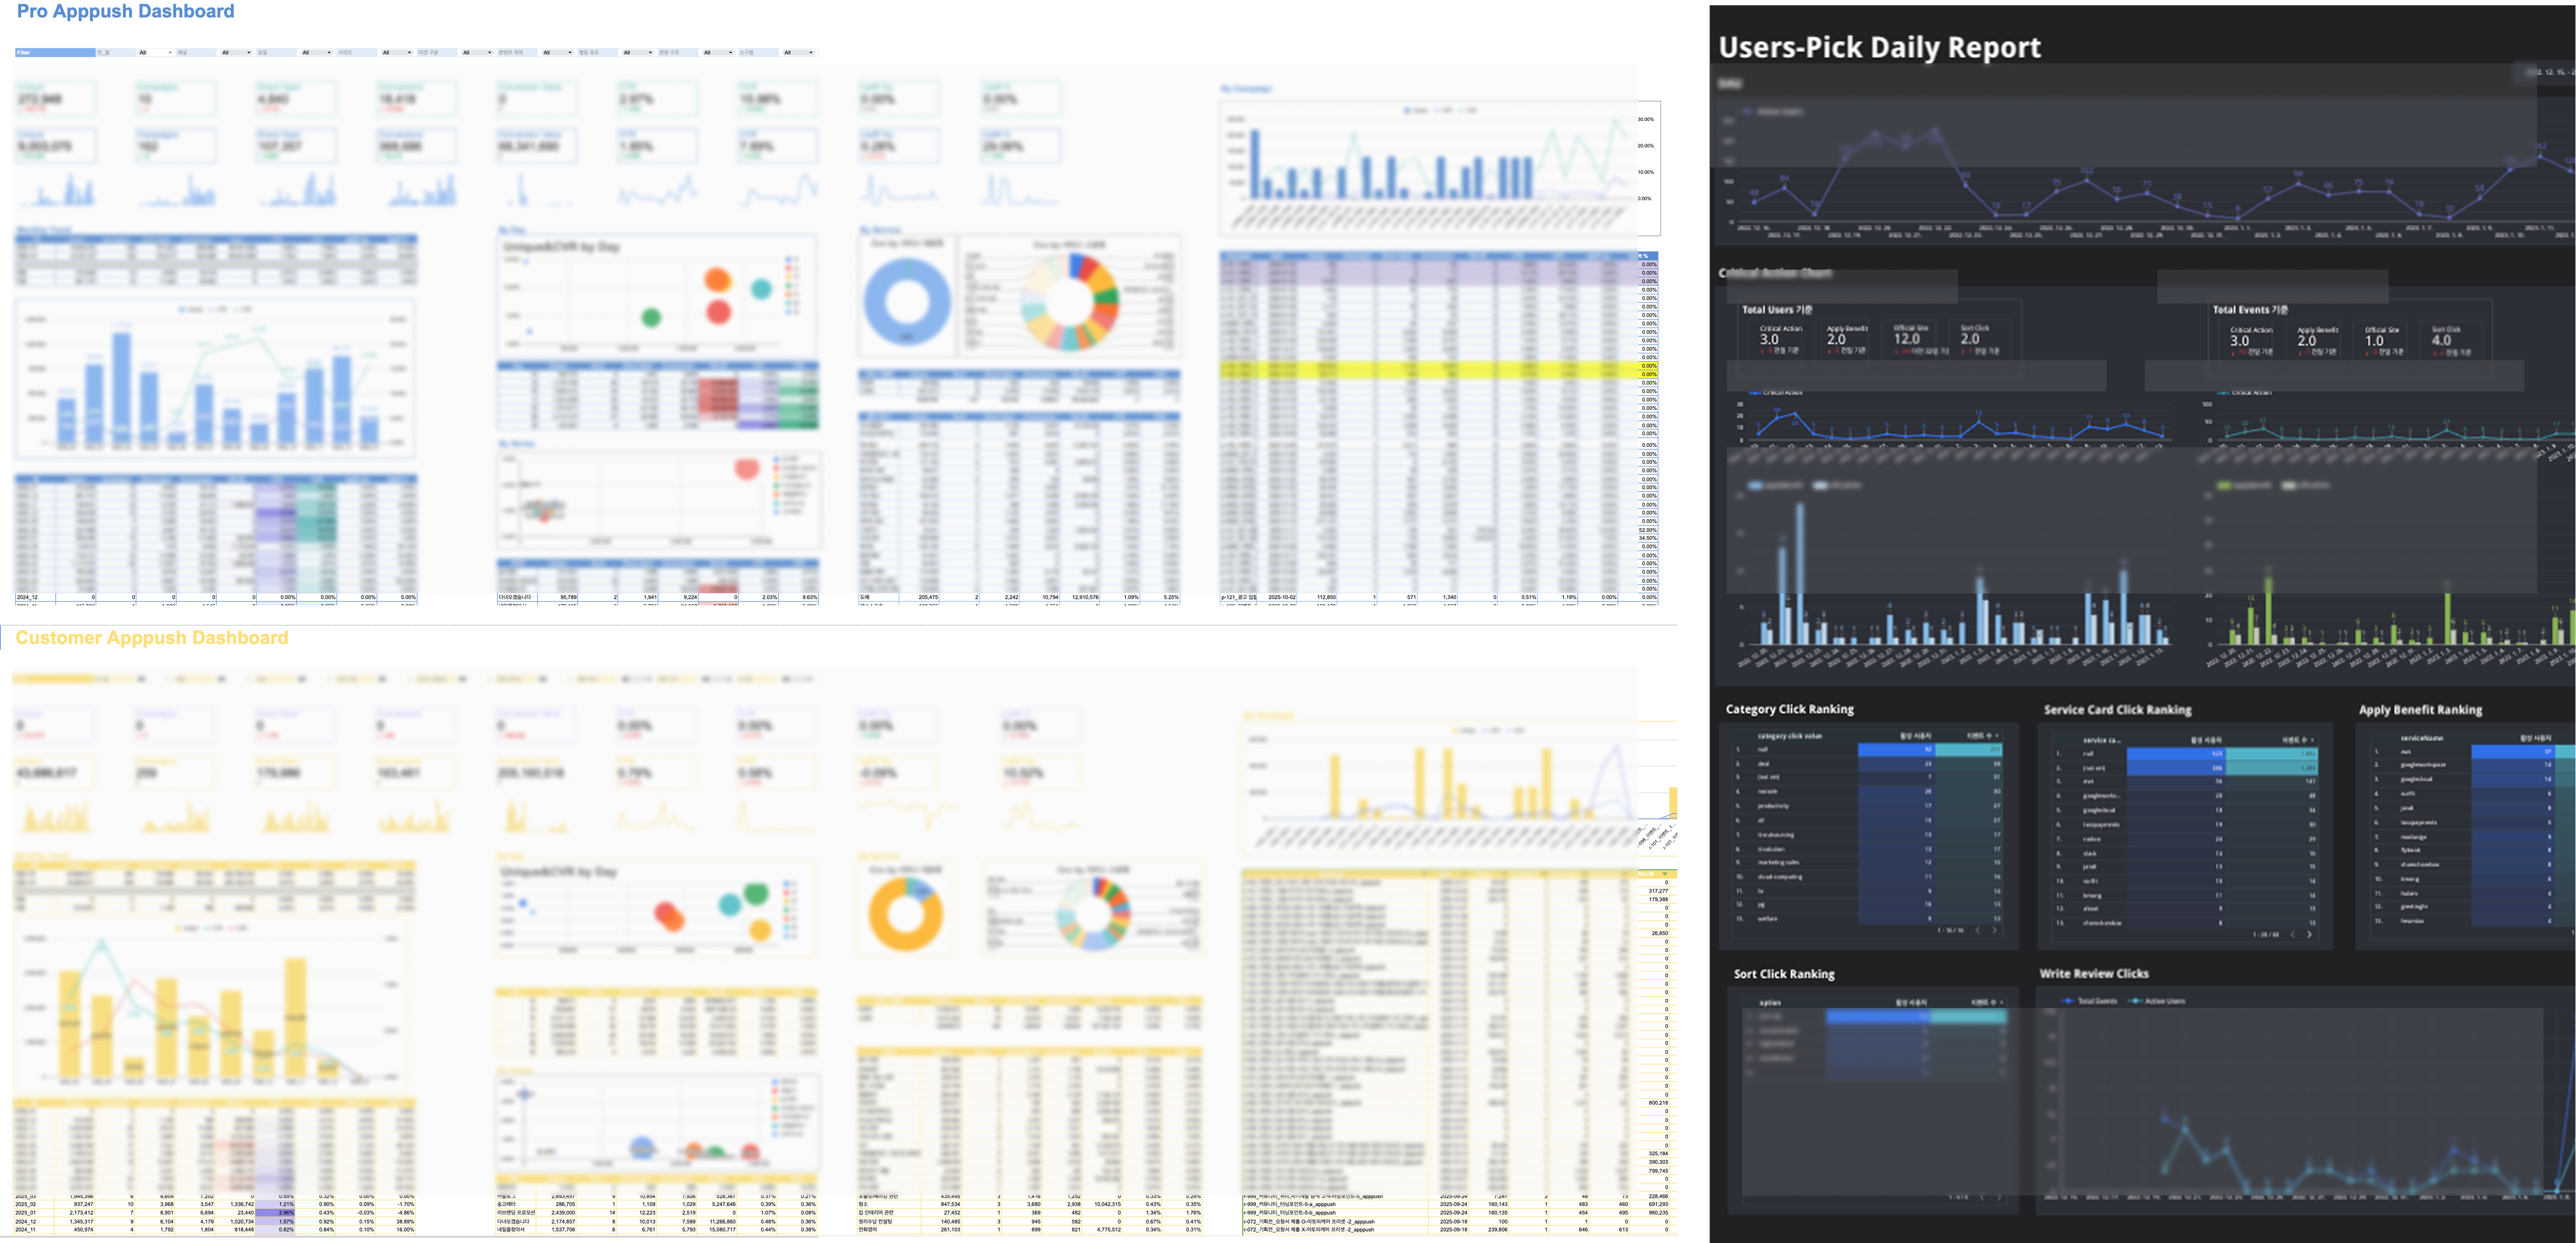
④ VERIFY
액션 후 결과 자동 검증
액션이 적용된 시점을 기준으로 지표 변화와 uplift% 추이가 차트로 자동 노티되어, 액션 전후 효과를 시각적으로 즉시 검증할 수 있습니다. Looker Studio 기반 대시보드로 채널별·캠페인별 성과를 일별·월별로 추적하며, 그 결과는 다시 다음 실험의 가설로 이어집니다.
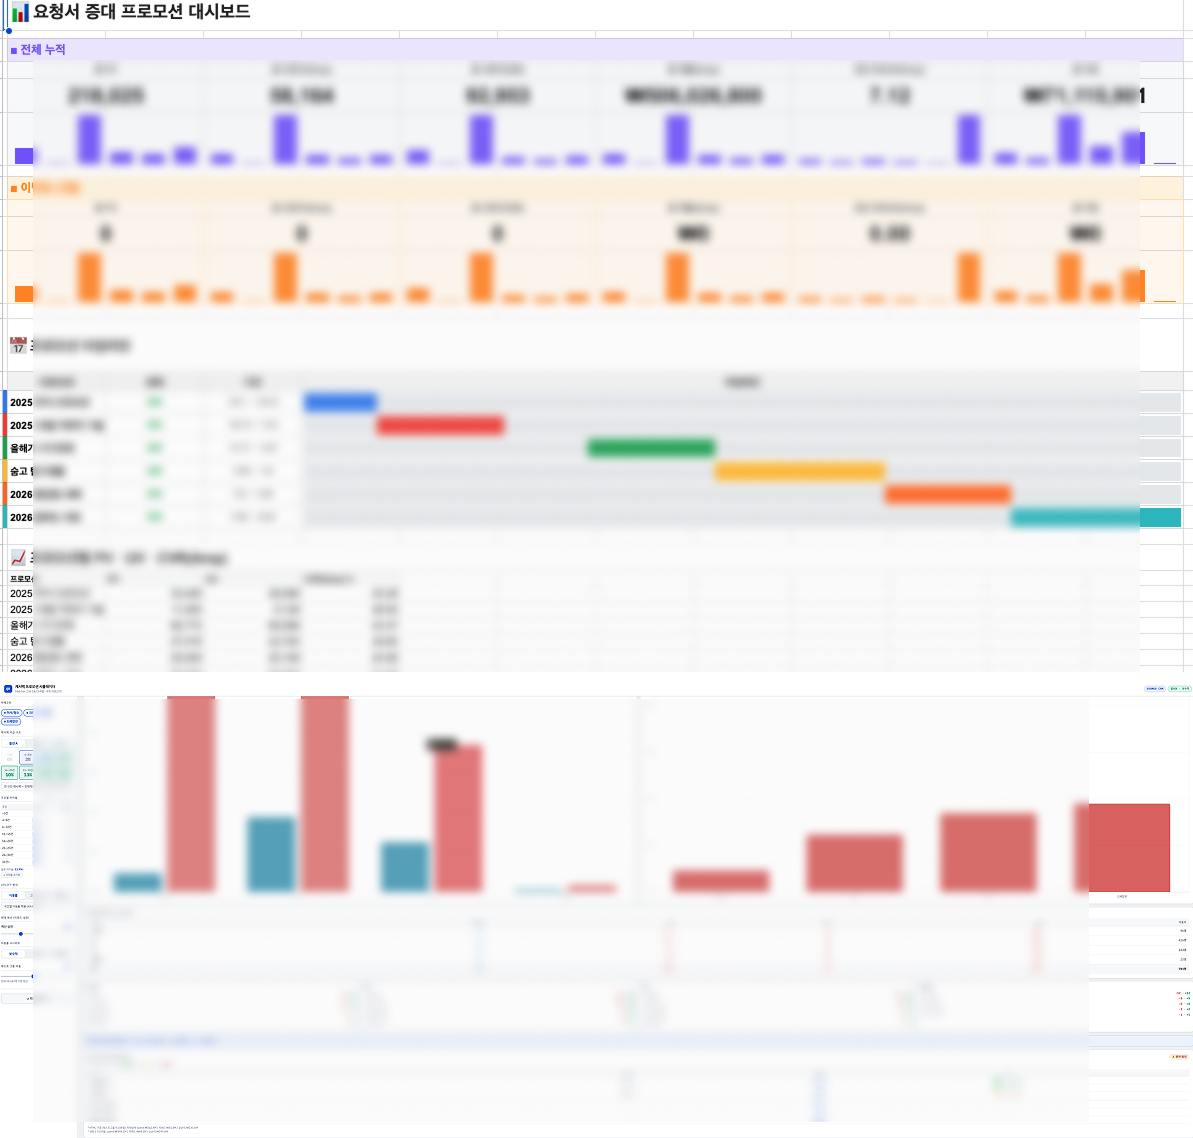
프로모션 단위로는 누적 성과 대시보드와 간트차트 기반 타임라인을 별도로 구축했으며, 구간별 이동률·iROAS를 실시간으로 계산하는 HTML 인터랙티브 시뮬레이터를 직접 구현해 마케팅팀이 동일한 기준으로 의사결정할 수 있게 했습니다.
⑤ EXTEND
자동화 위에서 추가로 한 일들
기본 운영 루프가 안정화된 다음, 같은 시스템 위에서 데이터를 더 깊이 활용하기 위한 작업들을 추가로 진행했습니다.
⑤-1 프로그램 운영 자동화
프로그램 신청 → DB 자동 적재 → 마케팅 수신 동의 자동 변경 → 자동 메일 발송으로 이어지는 파이프라인을 구축했습니다. BigQuery SQL로 신청자 현황을 실시간 추출하고, Google Apps Script로 후속 액션을 자동화해 운영 공수를 최소화했습니다.
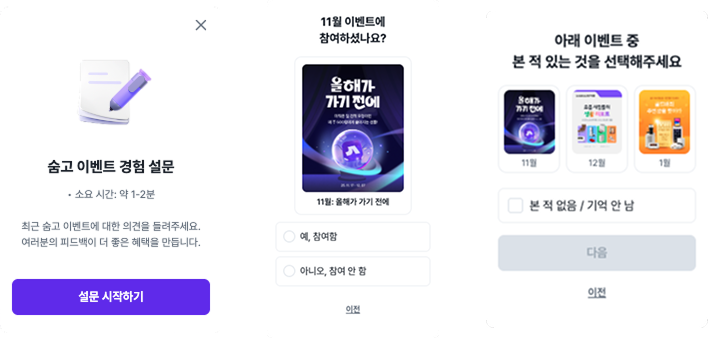
⑤-2 Braze Liquid 인앱 설문 구현
Braze Custom HTML IAM + Liquid 문법을 활용해 유저 참여 이력에 따라 질문 분기가 달라지는 인앱 설문을 직접 구현했습니다. 응답 결과는 brazeBridge로 Custom Attribute에 즉시 적재해 CRM 세그먼트에 반영했습니다.
Result
실험 1사이클의 리드타임이 짧아졌고, 마케터는 수치 확인·일정 관리·결과 시각화에 들이던 시간을 분석과 다음 실험 설계에 다시 쓸 수 있게 됐습니다.
Stack
Lead Generation
리드 제너레이션·리드 전환
~15,000개
2022년 연간 리드 확보
30%+ 전환
가입 전환, 행사 참여 등
Problem
- 각 팀 리드가 파편화되어 있고 관리가 미흡했습니다.
- 리드 제너레이션을 위한 전용 캠페인이 부재했습니다.
Hypothesis
수집된 리드를 유저 롤 별로 분류해 관리하고, 롤별 USP를 세분화해 푸시하면 리드 전환율이 증가할 것이다.
Execution
① 리드 제너레이션 및 전환 프로세스 확립
리드 제너레이션 관련 협업을 리딩 및 프로세스 효율화해 유저 롤별 세그먼트 분리 기준 수립 및 전환 트래킹 체계를 구축했습니다.
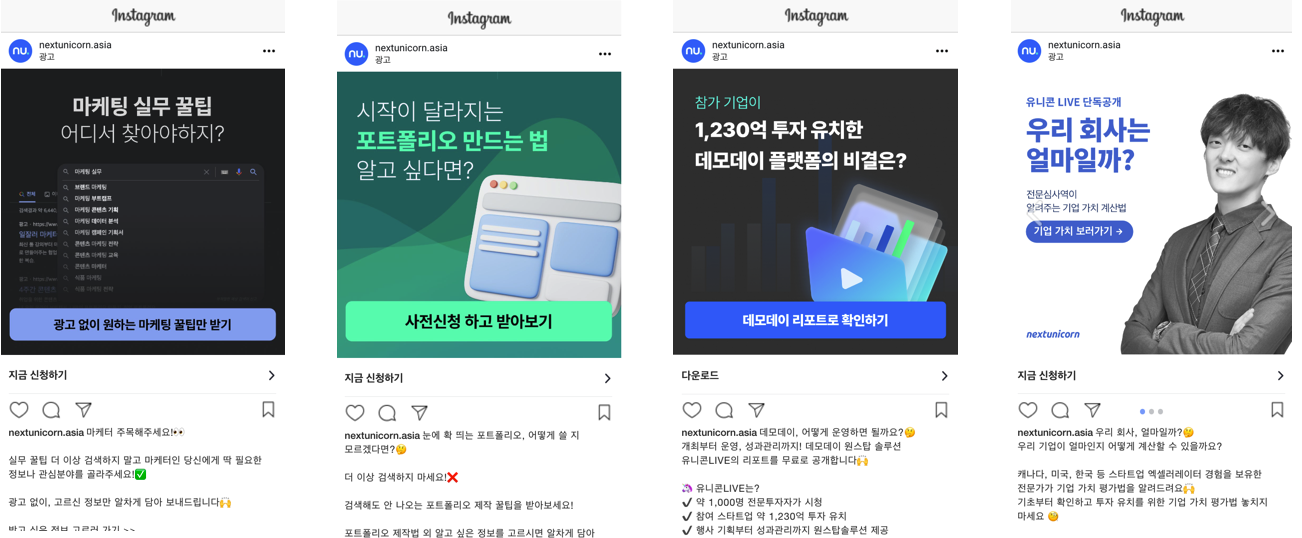
② Paid & Non-Paid 캠페인 집행
- Paid 캠페인 집행 및 성과 개선 — 타겟 세그먼트별 소재·메시지 최적화
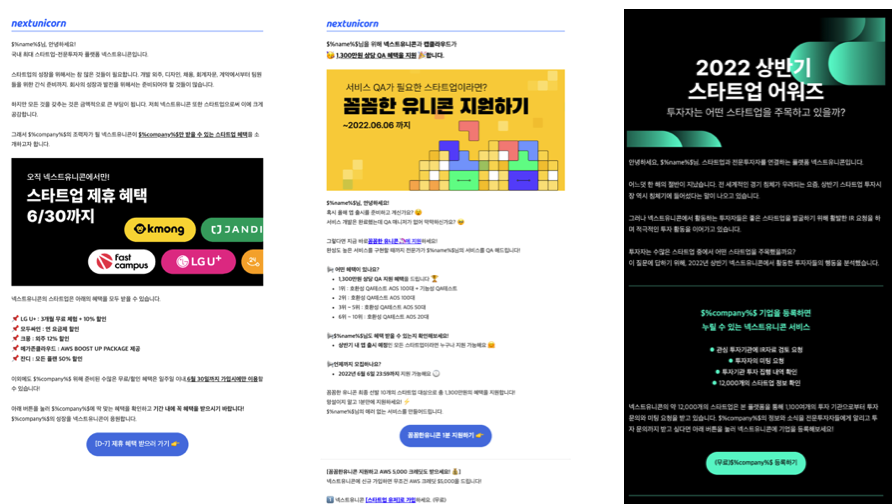
- Non-Paid 캠페인 집행 및 성과 개선 — 오가닉 채널 활용 리드 확보
Paid — Instagram 광고
Non-Paid — 이메일·뉴스레터
③ 리드 세그먼트 분리 및 관리 효율화
리드 관리 프로세스 정리 및 성과 관리 자동화 시트 제작하였고, BigQuery & Python을 이용해 리드 수집 현황을 실시간 모니터링할 수 있는 자동화를 구현했습니다.
검증 지표
Growth is a structure, not a moment.
Let’s build better ones.
If you'd like to talk more about my portfolio or projects — or have a growth problem worth solving together — feel free to reach out.