Per confidentiality agreement, certain figures, revenue data, and internal information have been modified or omitted.
Project · Soomgo
From a Provider's First Quote to Expanding Revenue: Awakening Soomgo's Growth Engine
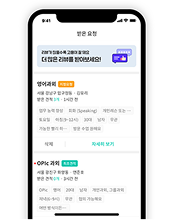
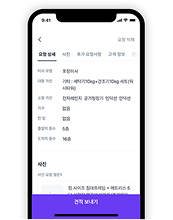
Soomgo is an on-demand service marketplace that connects millions of customers with expert service providers (Pros) across 300+ categories including home repair, personal training, and more.
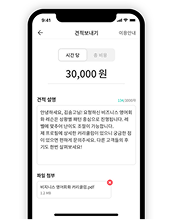
The platform operates as a two-sided marketplace where customers and providers interact, with revenue generated through two core actions — customers submitting service requests and providers sending quotes.
When a provider sends a quote in response to a customer request, the 'quote sending fee' charged is the platform's primary revenue model.
Customer
RequestQuote
Provider
a single growth system — structuring each stage so providers experience value early, repeat it, and engage more deeply over time.">Rather than running campaigns in isolation, I redesigned the provider journey as a single growth system — structuring each stage so providers experience value early, repeat it, and engage more deeply over time.
Payment Conversion Rate
+43.3%
Quote Conversion Rate
+32%
Promotion ROAS
1,249%
CONTEXT
The platform's overall Quote Rate (QR) is calculated as follows.
QR = Request Open Rate (OR) × Quote Send Conversion Rate (CR)
→ Request Open Rate (OR): The proportion of matched requests that were opened by the provider
→ Quote Send Conversion Rate (CR): The proportion of opened requests that resulted in an actual quote being sent
HIGH-LEVEL INITIATIVE
1. Provide providers with more job opportunities.
2. Accelerate providers' growth.
MY ROLE
Increase provider activation rate and revenue conversion rate
I own the end-to-end CRM strategy for Soomgo's service providers.
From onboarding to retention, I define and improve problems across every lifecycle stage, track funnel conversion and drop-off through data, and extract behavior-based segments and cohorts directly in SQL. I define and combine the roles of each channel — App Push, KakaoTalk notification, email, and in-app messaging — to maximize conversion and revenue while minimizing provider CRM fatigue.
I collaborate cross-functionally with POs, data scientists, data analysts, and UX researchers.
How I Work
Cross-Functional Collaboration & Working Process
I don't work in isolation — every project involves aligning with POs, data scientists, analysts, UX researchers, and engineers. Below is how I typically structure collaboration and communication across teams.
hubStakeholder Map
Who I collaborate with and how decisions flow
For each CRM initiative, I map the stakeholders involved — identifying Decision Makers, Contributors, and those whose buy-in is required. This helps me align priorities early, reduce friction mid-project, and ensure the right people review the right outputs.
PO / PMData ScientistData AnalystUX ResearcherEngineering
schemaUser Flow & System Diagram
How users move through the system and how components connect
Before designing any CRM flow, I map the full user journey — from trigger event to conversion — and document how system components (Braze Canvas, BigQuery segments, Custom Attributes, push/in-app/email channels) connect. This structured thinking ensures experiments target the right funnel stage and technical dependencies are clear before execution.
check_circleUser journey mapping before every experiment
check_circleSystem architecture for CRM automation flows
check_circleBraze Canvas flow documentation
check_circleSegment logic defined in BigQuery SQL
forumCommunication & Async Collaboration
How I communicate decisions and align teams
I prioritize written, structured communication — documenting experiment hypotheses, sharing results with clear takeaways, and keeping async records of decisions. This ensures alignment even without synchronous meetings, and builds a knowledge base the team can reference.
descriptionExperiment BriefBefore each experiment
Structured docs shared with PO & data team: hypothesis, target segment, expected impact, success criteria, and rollback plan — written before any execution begins.
insightsResults & RetrospectiveAfter each experiment
Post-experiment reports with segment-level analysis, not just top-line metrics. Includes "what we learned" and "what to test next" — ensuring every experiment feeds the next one.
group_workCross-Team SyncWeekly cadence
Weekly alignment with PO and data teams on experiment pipeline, priority changes, and shared metrics. Async updates for non-blocking decisions; sync meetings reserved for trade-off discussions.
New Provider Onboarding & Request Response Conversion Improvement
01
PROBLEM
Surface-Level Growth, Declining Engine Efficiency
QR
Request Received
OR
Request Opened
CR
Quote Sent
YoY
Overall Quote Send Rate ▼ -6.76%
Request Open Rate ▼ -1.70%
Quote Send Conversion Rate ▼ -5.17%
YoY Comparison by Funnel Stage (2023 vs 2024)
20232024
The growth engine was losing efficiency simultaneously at two stages. New providers were failing to convert to their first payment during the initial onboarding period, and across all providers who received requests, the rate of actually sending a quote after reviewing the request was gradually weakening.
The decline was not distributed evenly across all stages. The drop in actual quote-sending conversion rate (-5.17%) far exceeded the decline in request open rate (-1.70%).
In other words, the problem was not a drop in traffic but a deterioration in the engine efficiency leading to the final action. Subsequent analysis and execution efforts were narrowed down to removing barriers at the stage immediately before sending.
02
DIAGNOSIS
The First Break Was at the Very Starting Point of the Growth Engine
Breaking down funnel data by cohort, a significant portion of the decline originated from new provider churn. Only 15% of new providers completed their first payment within 7 days of sign-up, and the 1-month payment rate dropped 6.3pp year-over-year. Providers who failed to convert to a first payment during this period almost always churned.
In other words, the overall efficiency decline was not only a pre-send problem but also the cumulative result of new providers failing to get established right from the engine's starting point.
First Payment Conversion Rate Within 7 Days of Sign-Up
Drop-off occurs continuously across post-signup stages, with the largest gap appearing in the transition from first payment to first quote sent.
Trend in First Payment Rate Within the First Month After Sign-Up
Initial payment conversion shows a declining trend, and new providers' failure to establish their first action amplified the overall decline.
Conversion Rate Fell, and Time to Send Grew Longer
Quote send conversion rate after viewing a request dropped from 35.7% to 32.7%, and the median time to send a quote increased from 8 hours 36 minutes to 10 hours 28 minutes. Conversion rate was declining while send decision speed was also slowing simultaneously. Following the same funnel further, cash purchase and store visit conversion rates within the quote-sending funnel were also declining. Drop-off was largest at the cash shortage notification modal in particular. Both the declining conversion rate and slower send speed, along with drop-off concentrated at a specific point, signaled the existence of a barrier causing providers to hesitate right before sending.
Defined Problem
New providers' failure to establish themselves early combined with pre-send barriers, structurally weakening the efficiency of the growth engine leading to quote sending.
03
STRATEGY
Redesigned the Conversion Structure to Re-Ignite the Engine
The problem was occurring simultaneously at two points — the starting point of the engine and the stage immediately before sending. Accordingly, the solution was designed not as a single action, but by redefining the first payment as the activation benchmark, reducing friction immediately before sending, and delivering messages aligned with the moment of action.
Redefined the Activation Benchmark
Data analysis revealed that, on average, the first quote was sent within 10 minutes of the first payment. This meant that the first payment was not simply a payment event, but the conversion point where providers begin taking real action.
Conversely, providers who did not make a payment within 7 days of sign-up mostly churned thereafter, with over 60% of non-paying providers churning within just one day of signing up. It was therefore concluded that the most critical golden window for improving new provider onboarding was the first 24 hours after sign-up.
Ultimately, early growth was a question of how quickly first payment conversion could be achieved.
04
EXECUTION
Reduced Pre-Send Friction and Designed Messages Aligned with the Moment of Action
I redesigned the initial friction stage and structured the experience to bring the activation benchmark forward, helping new providers reach their first payment faster.
For new providers with no payment history, entering the store and making a first purchase were prerequisite steps before sending any quotes. As defined earlier, the first payment was not merely a purchase but the activation benchmark where real action begins.
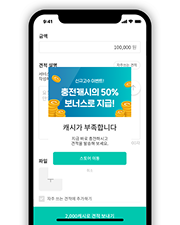
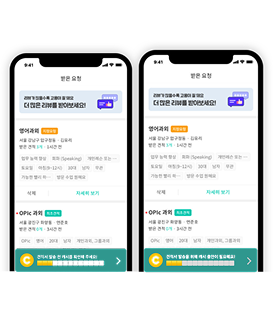
However, the existing structure only informed providers of insufficient cash after they had already written a quote. Being asked for additional payment after already investing time and effort amplified friction right before sending, and high drop-off was in fact occurring at this stage.
I therefore hypothesized that moving the cash shortage notification to before the quote is written would accelerate store entry and also improve first purchase conversion. Experiment results showed that the newly designed modal significantly improved same-day purchase conversion rate by 43.3% compared to the existing system modal.
AS-IS
Cash shortage was only surfaced after the quote had been written, meaning drop-off could occur after the provider had already invested time and effort.
TO-BE
Changed to surface the cash shortage state before writing, creating a natural path into the store and cash top-up flow.
Figure — Cash Shortage Modal Improvement: AS-IS (notified after writing) vs TO-BE (notified before writing)
Next, I optimized the timing of state-based reminder messages within the request response stage for both post-first-payment and existing providers.
By redesigning the reminder timing and message context within the request response stage, I connected them into a conversion flow that improved both OR and CR together.
Experiment Result
OR+24.55%Quote Open Rate
CR+6.19%Quote Sent After Request Review
QR+32%Quote Conversion Rate
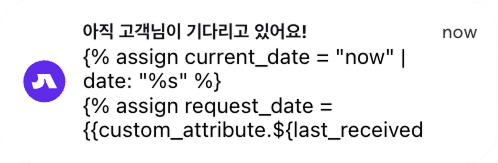
Across all providers who received requests, the conversion rate from reviewing a request to actually sending a quote was gradually declining. Providers were only receiving individual request notifications, and information about how much time had passed since receiving a request was barely accessible outside the product. Since many providers were checking requests intermittently while juggling other work, missing the initial notification often led to unread requests going unchecked.
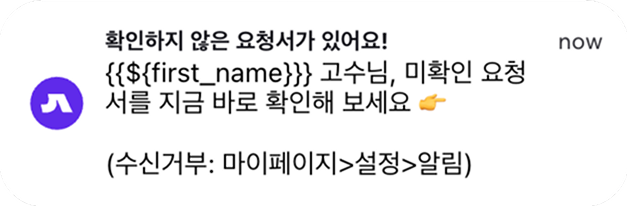
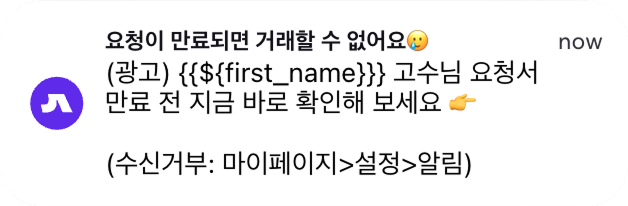
Data showed that most providers sent their quote within 1 day of opening the request. This meant that even the same reminder could vary greatly in effectiveness depending on who received it and when. I therefore designed an experiment that branched reminder timing based on the request review status.
Experiment results showed that for providers who had opened but not yet sent a quote, 24 hours after opening was most effective; for providers who had not yet opened, 1 day before the request deadline was most effective. The former aligned with the pattern of providers checking requests in batches during specific off-work hours, while the latter was well-suited to trigger loss-aversion psychology — being the point after which responding becomes impossible. Overall, this improved quote open rate by 24.55%, quote send conversion after request review by 6.19%, and overall quote conversion rate by 32%.
Figure — Examples of reminder app push notifications designed differently based on request review status and context
05
RESULT
Conversion Efficiency Recovered Across Both New Provider Onboarding and Request Response Stages
By simultaneously improving new provider onboarding and the response conversion stage across all providers, conversion efficiency was recovered at both the starting point and the repeat stage of the growth engine. Redefining the first payment as the activation benchmark, reducing pre-send friction, and delivering messages aligned with the moment of action improved both the engine's starting point and its final stage.
Ultimately, this project was not merely a notification enhancement — it was a redesign of the conversion structure to help providers quickly move into real action after their first payment and repeatedly engage thereafter.
The Conversion Rate Was Visible, but Why Providers Stopped Was Not
Data showed the outcome, but not why providers stopped taking action.
Funnel data alone could not explain at which point and for what reason providers were stopping their actions.
02
DIAGNOSIS
Behavioral Barriers Outside the Funnel Were Stopping Conversions
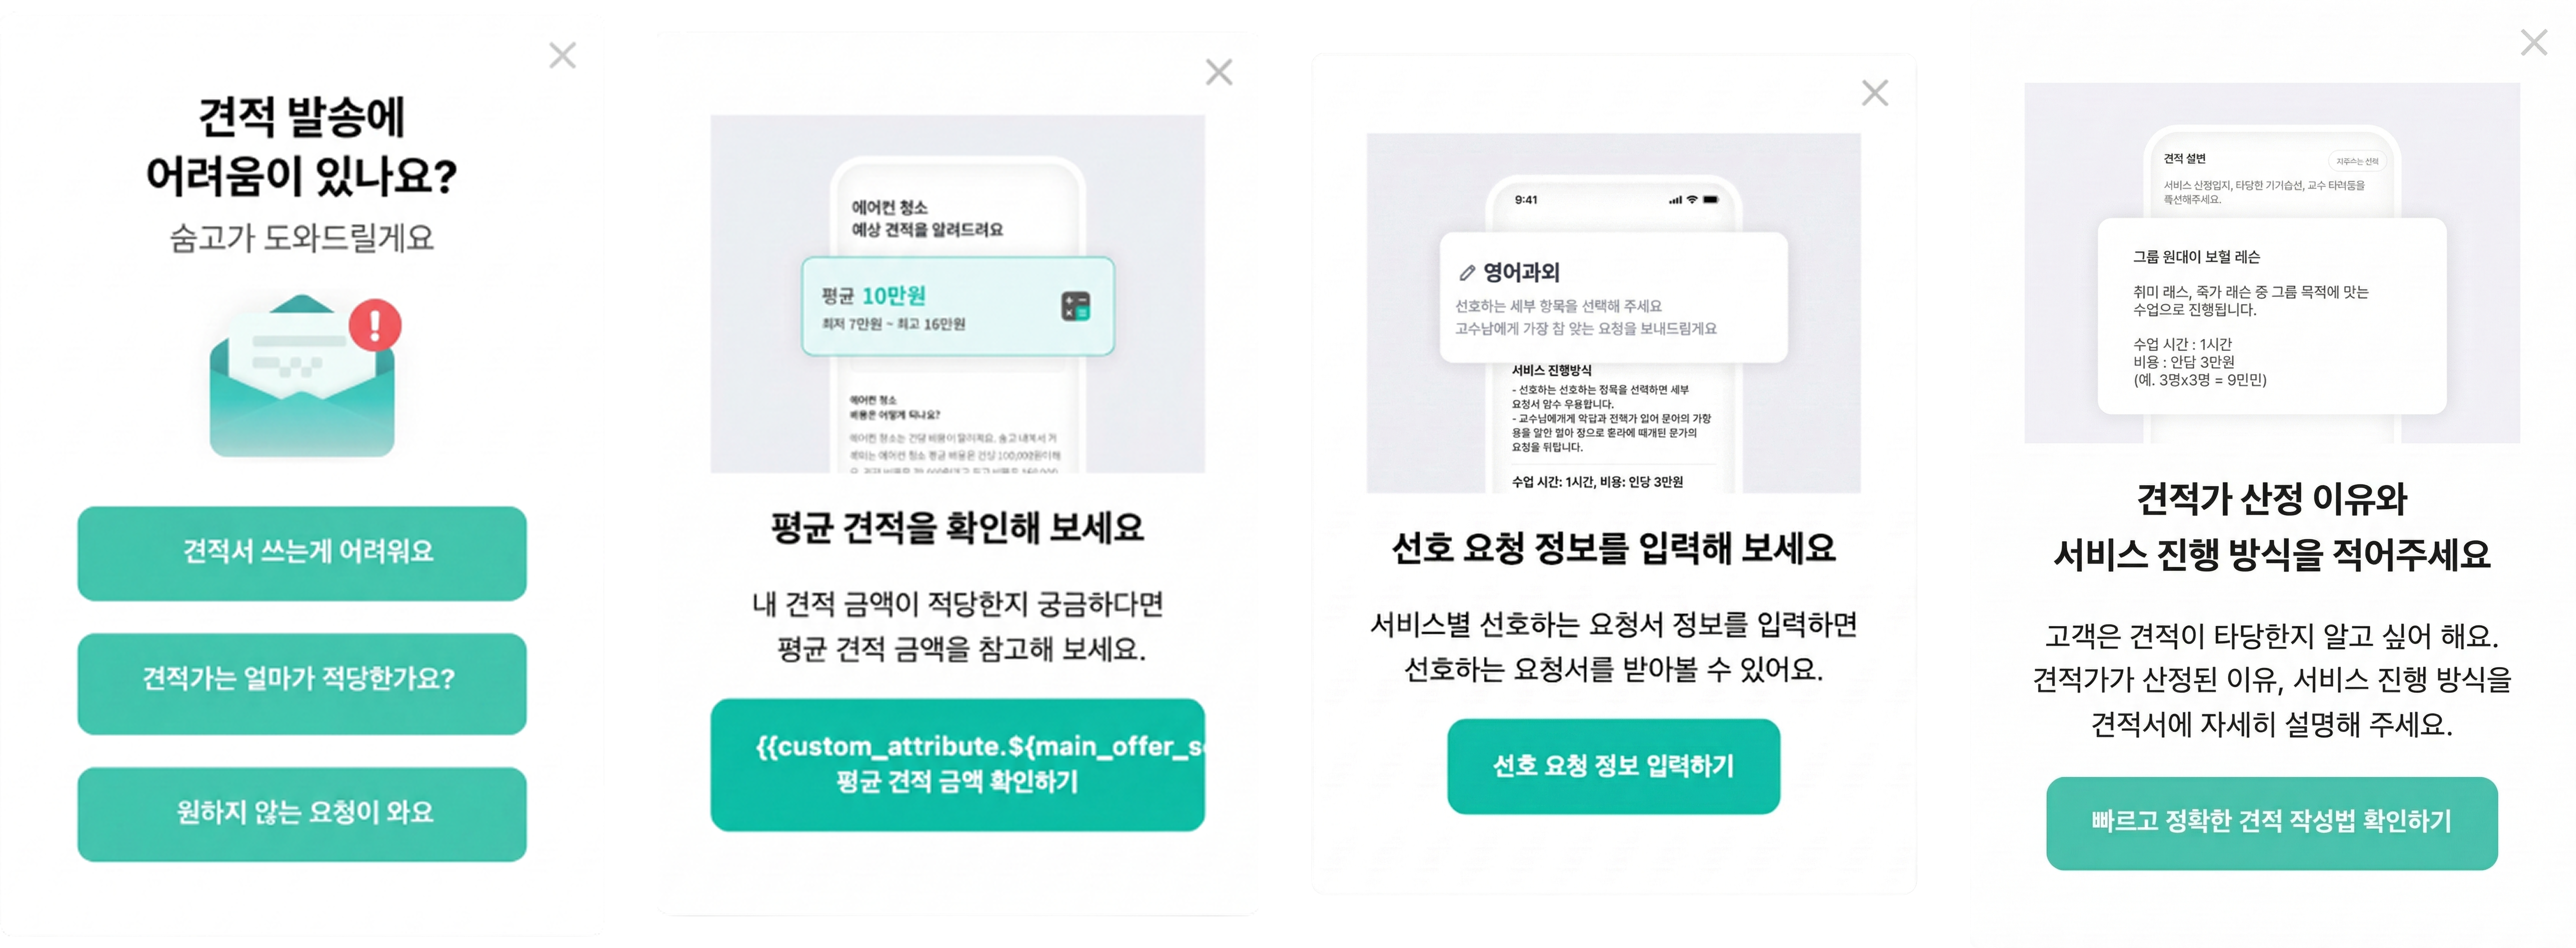
If quantitative data couldn't provide the answer, asking providers directly was the fastest way to identify the cause. Without additional product development, I implemented a survey modal directly using Braze in-app message custom code, collecting zero-party data through button click responses to understand the actual pain points providers were experiencing.
Figure — Survey modal deployed to collect quote non-submission reasons and provide guidance
CTA Response Comparison by Quote Sending Experience
Figure — CTA Response Comparison by Quote Sending Experience (based on CTR)
Even among the same non-senders, new providers felt more burden in getting started, while existing providers felt more burden in making a judgment.
No Quote Sending Experience
• The quote-writing process itself feels complex
• Unclear which information to enter first
• Writing burden leads to deferring the first attempt
Has Quote Sending Experience
• Uncertainty about how to price a quote
• Stronger per-request ROI evaluation
• Tendency to respond selectively, even to similar requests
User interviews and surveys confirmed that what was blocking conversion was not a lack of features, but uncertainty about outcomes and behavioral barriers.
DEFINED PROBLEM
Quotes were written but not sent. Right before sending, providers lacked the necessary information and confidence.
The goal was to create a state where new providers could 'just try sending once', and for existing providers, a structure that allowed faster pricing judgment and send decisions immediately after reviewing requests. The core of the solution strategy was not simply increasing exposure but more precisely removing the barriers right before sending.
Although the modal was deployed for survey purposes, an unexpected result emerged. Providers who clicked the CTA to access the guide content showed approximately 9% higher quote send conversion within 1 hour compared to those who closed the modal. It was concluded that the bigger problem was not an absence of information, but the absence of a delivery mechanism connecting necessary information right before the moment of action.
03
STRATEGY
If the Reasons Providers Stop Differ, the Messages Delivered Must Also Differ
Rather than solving the problem with a single message, I concluded that different approaches were needed based on barrier type and redesigned the structure accordingly.
04
EXECUTION
Designed Different Modals and Messages for Each Barrier Type
Experiment Result
QR+9.26%Quote Send Conversion Rate
Response+17.8%Customer Response Rate Within 1 Day of Quote Open
AS-IS
The existing system modal had information, but was not sufficient in its guiding role toward action.
TO-BE
The improved modal was redesigned to more directly address the core barriers of pricing a quote and writing the quote itself.
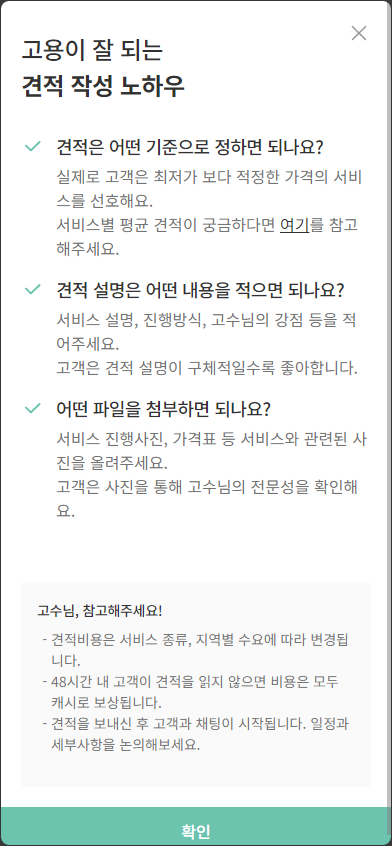
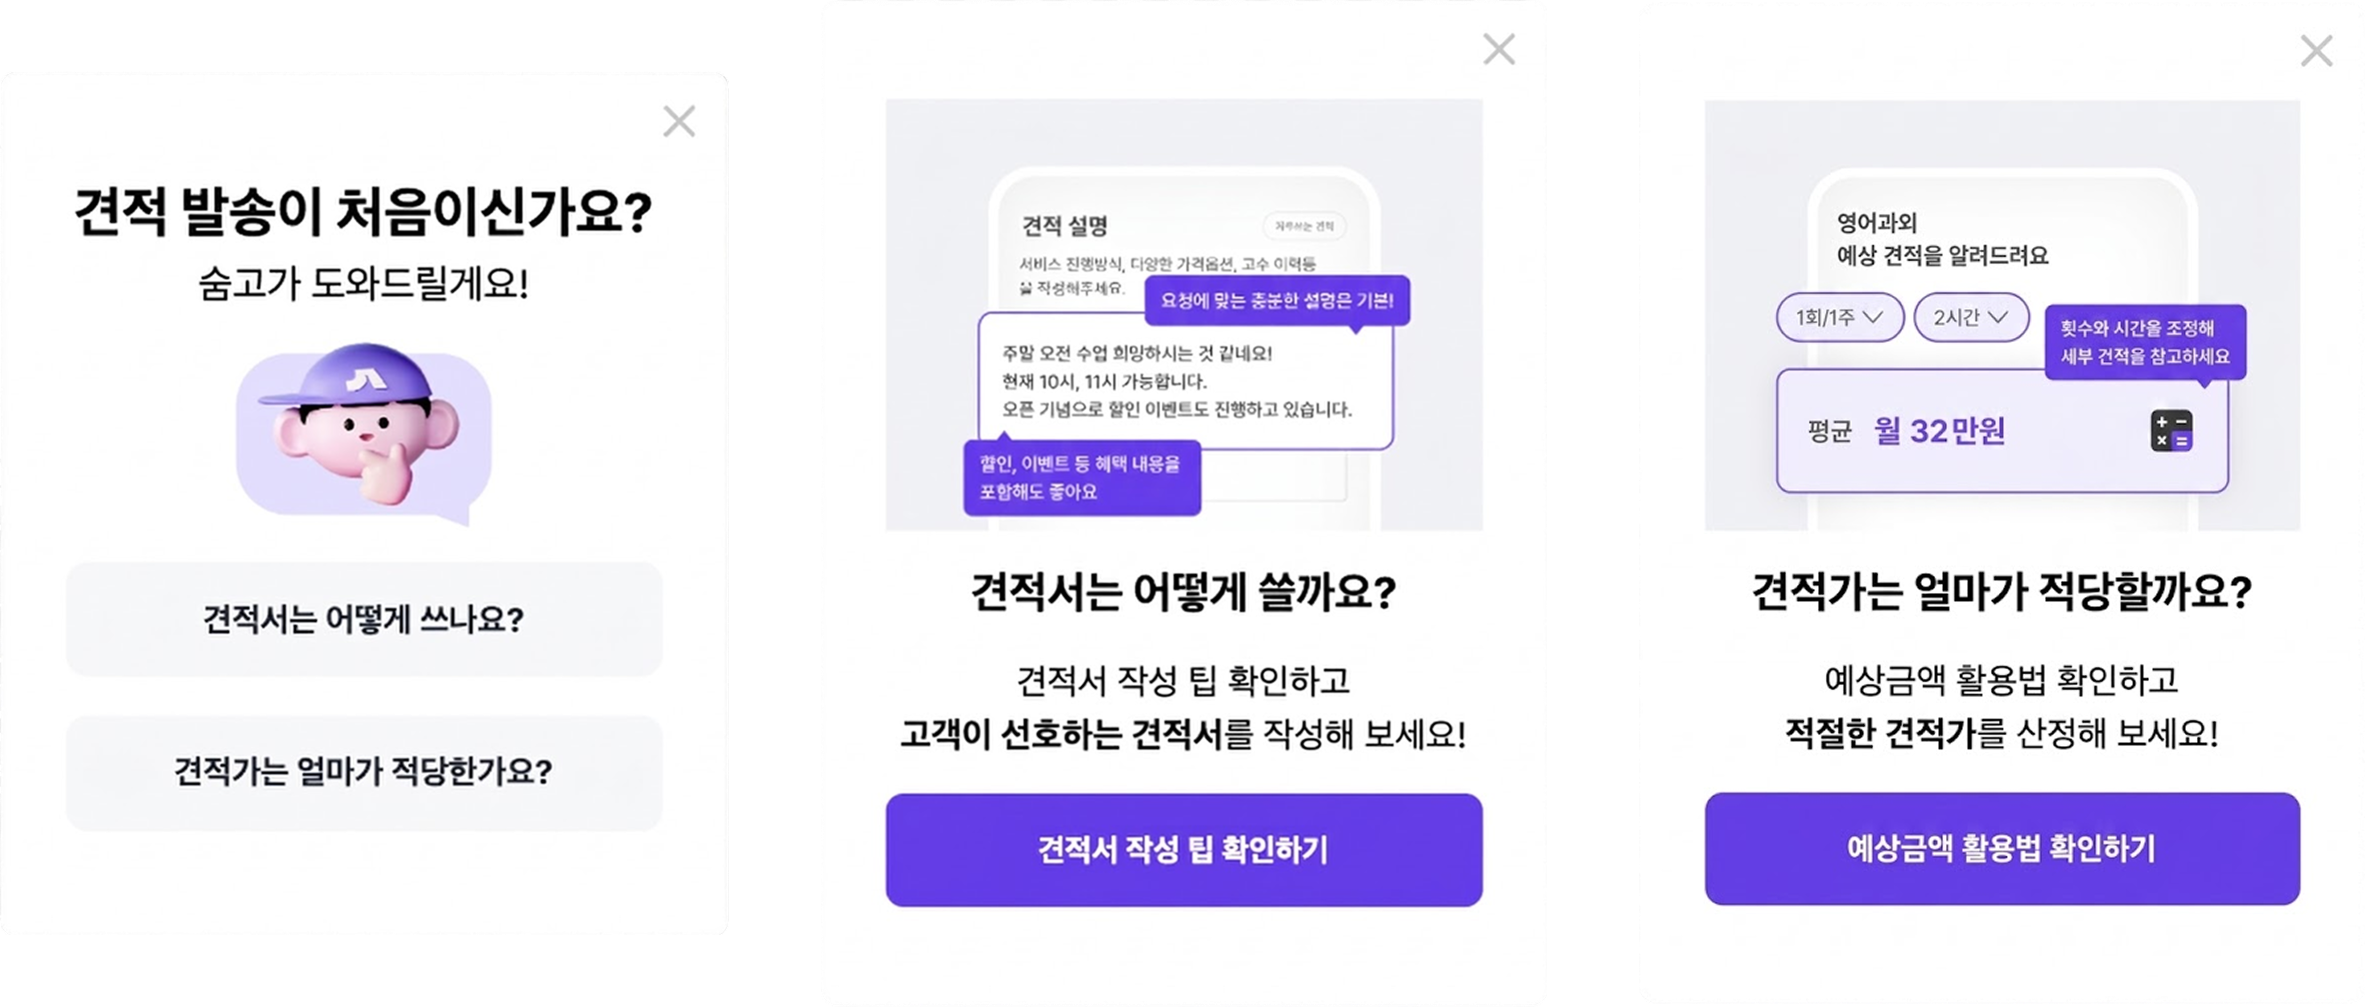
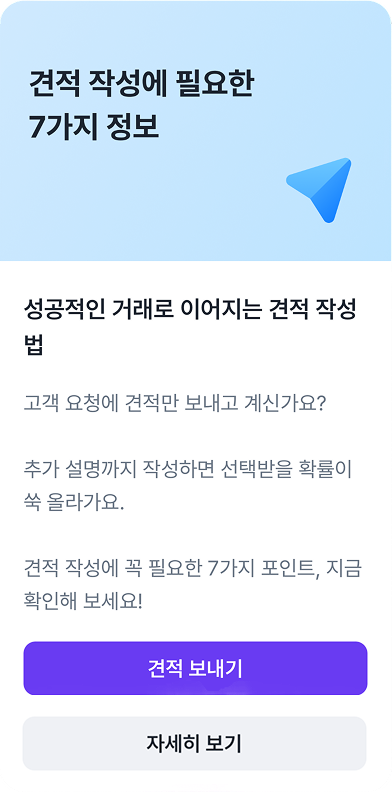
Figure — Quote Writing Guide Modal Improvement: AS-IS vs TO-BE
Based on these results, I further examined whether there was a mechanism that could actually alleviate the difficulties of 'pricing a quote' and 'writing a quote' — the main causes of drop-off for new providers at first payment and first quote. It was found that the existing AS-IS system modal displayed before quote writing was not sufficiently delivering the necessary information and action guidance, leading to the improved guide modal campaign. In the improvement experiment, quote send conversion rate improved significantly by 9.26%.
Repurchase Conversion Comparison
Repurchase Conversion Rate Within 7 Days of Sign-Up
Repurchase conversion rate within 7 days of sign-up
Repurchase Conversion Rate Among Providers Who Made First Payment
Repurchase conversion rate among providers who made first payment
Challenges remained even after the activation improvement. Even when first payment was achieved, it did not lead to repeat behavior. The repurchase conversion rate within 7 days of sign-up was 7%, and repurchase rate among providers who made a first payment was only 30%.
New Provider Repurchase Drop-Off Reason Survey Responses
Figure — New Provider Repurchase Drop-Off Reason Survey Responses
Response Rate vs. Quotes Sent
Response Rate vs. Opened Quotes
Figure — Customer response rate after quote sending: 18.8% based on sent, 26.8% based on opened
Research identified customer non-response after quote sending as the primary cause of repurchase drop-off. The customer response rate was 18.8% against quotes sent, and only 26.8% against quotes opened. Non-response was a structural problem that was actually weakening repeat conversion.
What Differentiated Repurchasers Was the Experience After First Payment
The graph shows the distribution of customer response experience rate by repurchase status. Repurchasers had a higher proportion of experiencing customer responses than non-repurchasers, suggesting that the customer response experience after first payment may be connected to repeat behavior.
Customer Response Experience Rate
Figure — Post-First-Payment Behavioral Experience Comparison by Repurchase Status
Further analysis with the data team also confirmed that what differentiated repurchasers was not the speed of first payment but the experience that followed. Quote send volume, request open rate, and whether the provider experienced customer responses were the key variables.
Why Don't Customers Respond?
There were two reasons customers didn't respond. For those who didn't open the quote, price dissatisfaction was common; for those who opened but didn't respond, many didn't know what or how to reply. The gap between the information customers wanted (price comparison range, quote details) and the information providers supplied was blocking responses.
"
"I don't know what to start with or how to do it well. It feels like I'm just expected to figure it out on my own."
"
"I've been trying to figure out how to use Soomgo, but the answers in the app aren't clear. I don't know how to get clearer information."
"Soomgo is a place where only people who can figure it out themselves survive."
"I just keep opening and closing things. It's hard."
"The time I spend on Soomgo isn't long enough to invest in searching for information. So it's difficult to dig things out persistently. I'd like the necessary information to be shown at the right moment."
So What Information Needed to Be Reinforced to Generate Customer Responses?
Provider Behavior Nudge
For providers without customer replies, reconnecting them to pricing guidance and quote content reinforcement guide
Customer Behavior Nudge
App push designed to help customers recall the quote they received and initiate a response
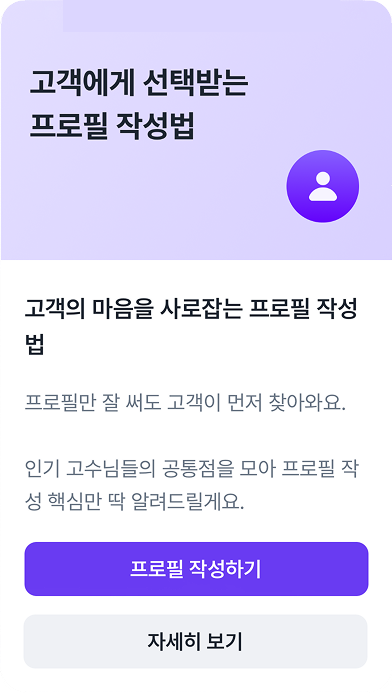
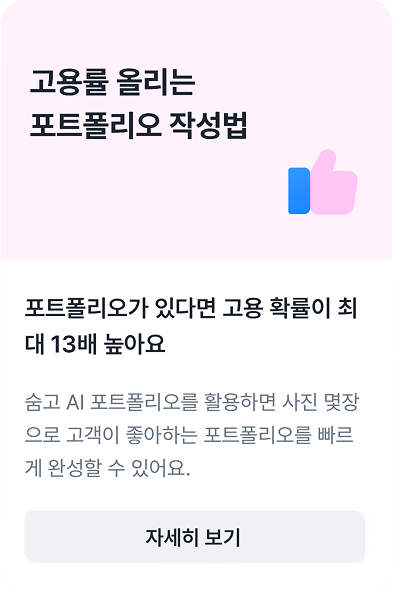
There were two solution directions. One was to directly prompt customers to respond; the other was to increase provider appeal and strengthen their hiring competitiveness when exposed to customers. For customers, I designed an app push to help them recall the quote they received and initiate a response. Accounting for the two barriers of price dissatisfaction and the burden of responding, the approach focused on communicating the reasons to respond — such as price comparison and quote detail review — more clearly rather than simply offering benefits. Meanwhile, providers didn't know what information customers used to make hiring decisions after receiving a quote. I reconnected providers to pricing guidance and quote content reinforcement guides so they could better reflect the key information (experience, reviews, detailed description, quote content) that influences customer hiring decisions. Providers who sufficiently entered this information did receive more customer responses, and response experience was also connected to repurchase likelihood. Compared to the control group, customer response rate within 1 day of quote open increased by 17.8%, and the guide application rate among TG providers was 13.93% higher. However, the higher guide application rate also implied that, until then, necessary information was not being sufficiently delivered to both new and existing providers.
Experiment ResultGuide Chat Room — Click Users Only
While reminder notification and guide modal improvements each addressed timing and information delivery, providers needed messages that delivered necessary information together at the right moment to actually take action. A channel was needed to rapidly test the optimal combination of timing and content, and the guide chat room was designed for that purpose.
However, the guide chat room experiment results differed from expectations. Across the entire TG, first payment rate, first quote send rate, repurchase rate, and hire rate all declined slightly compared to CG. But when the segment was broken down, a different picture emerged. TG users who did not click were pulling down the overall average, while users who did click showed much stronger follow-up behavior: first payment rate +226%, repurchase rate +285%, and 21-day hire rate +243% compared to CG.
This showed that the guide chat room was less a strong performance channel in itself, and more a channel that could capture or amplify users with high conversion potential when a click occurred. Therefore, the core challenge was not whether the channel existed, but what content and structure would increase click-through rate.
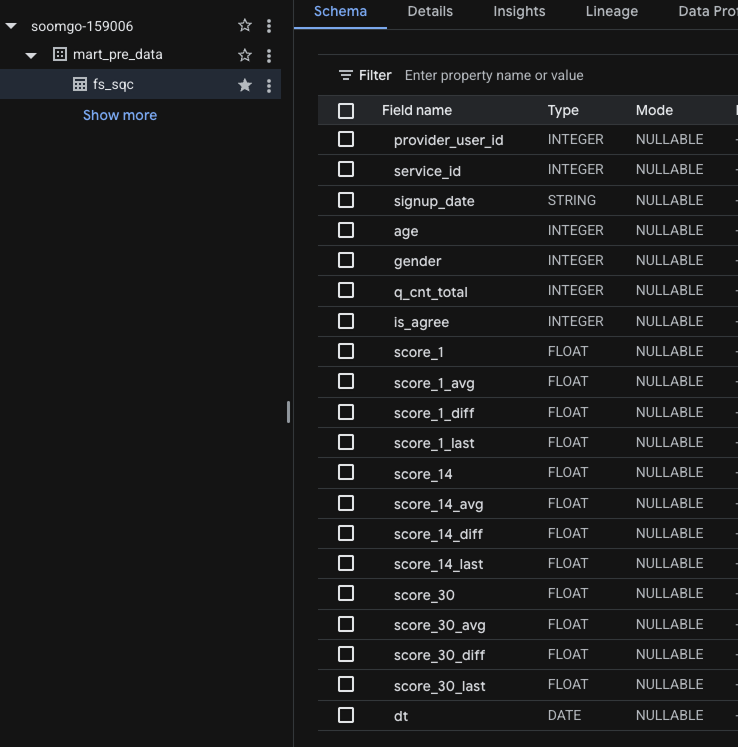
BigQuery data mart managing prediction scores at the provider·service level
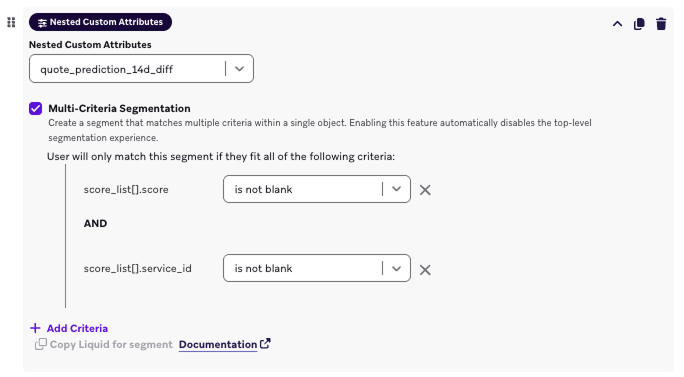
Structure connecting BigQuery prediction values to Braze user properties
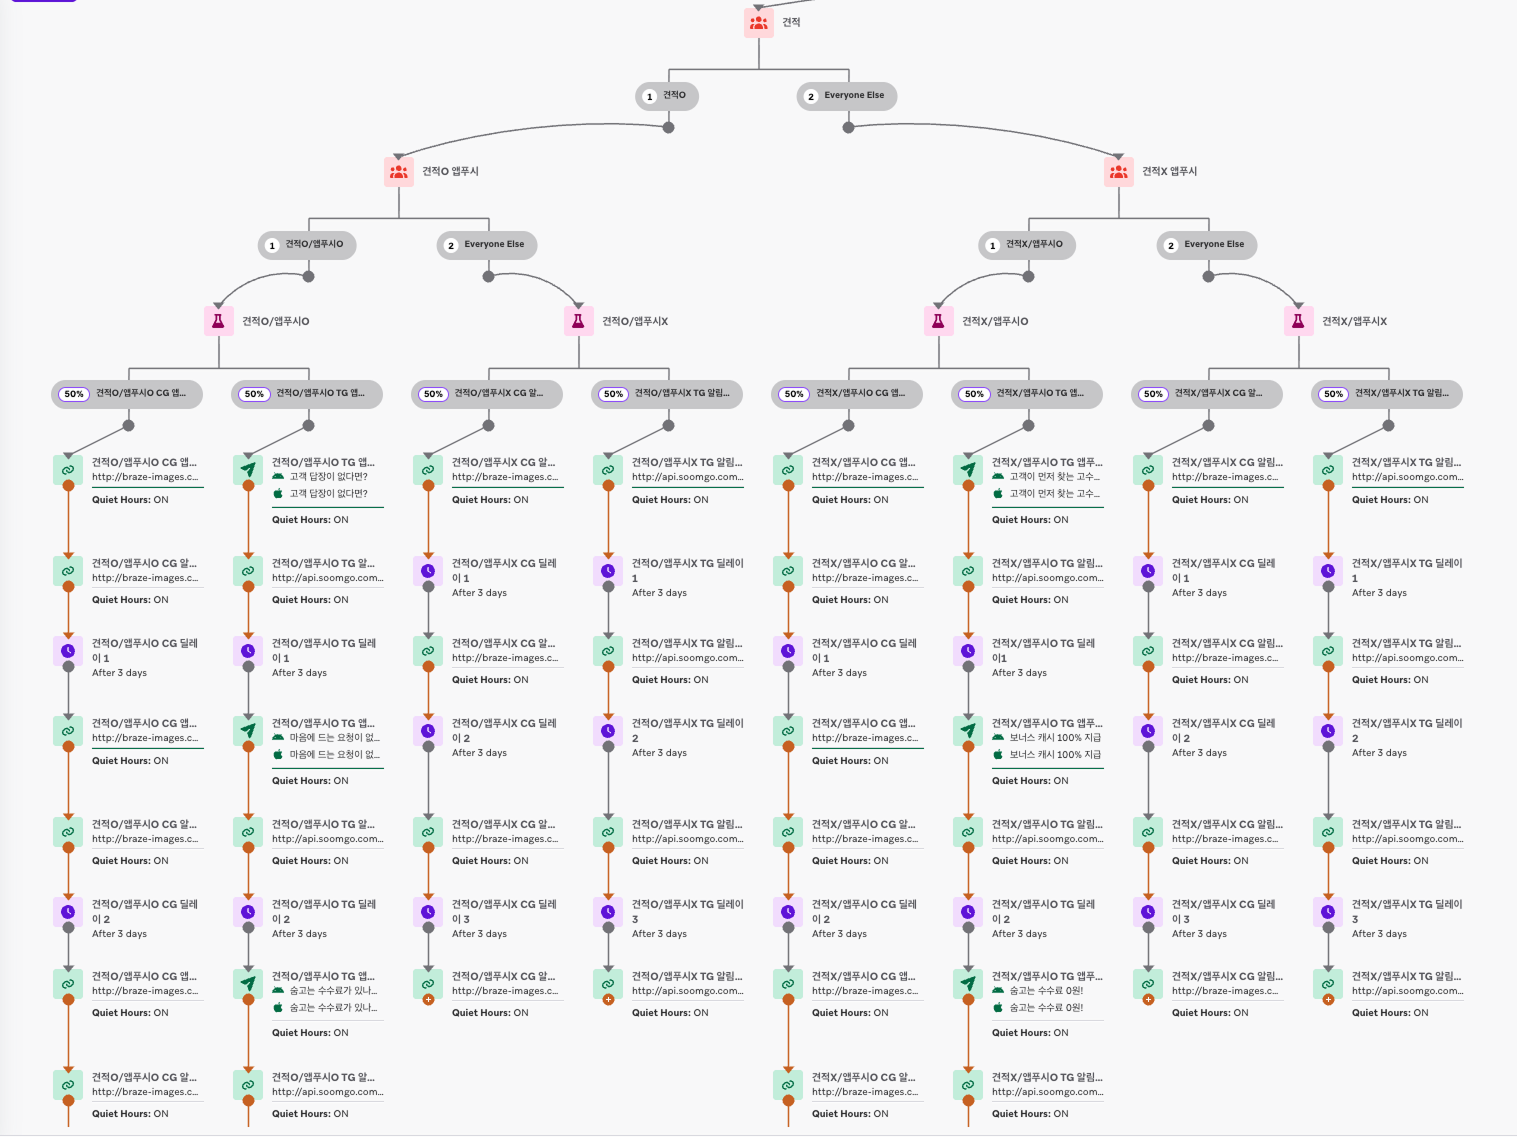
Operational structure branching segment-specific messages and send timing in Braze Canvas
Figure — Provider·service level prediction score data mart and CRM experiment operation pipeline
However, the current segmentation structure had limitations in deriving the optimal segment × USP combination. Accordingly, I conducted a quote send prediction model experiment with data scientists and analysts. The model predicted quote sending probability at the provider × registered service level, using RFM variables and recent behavior data as inputs.
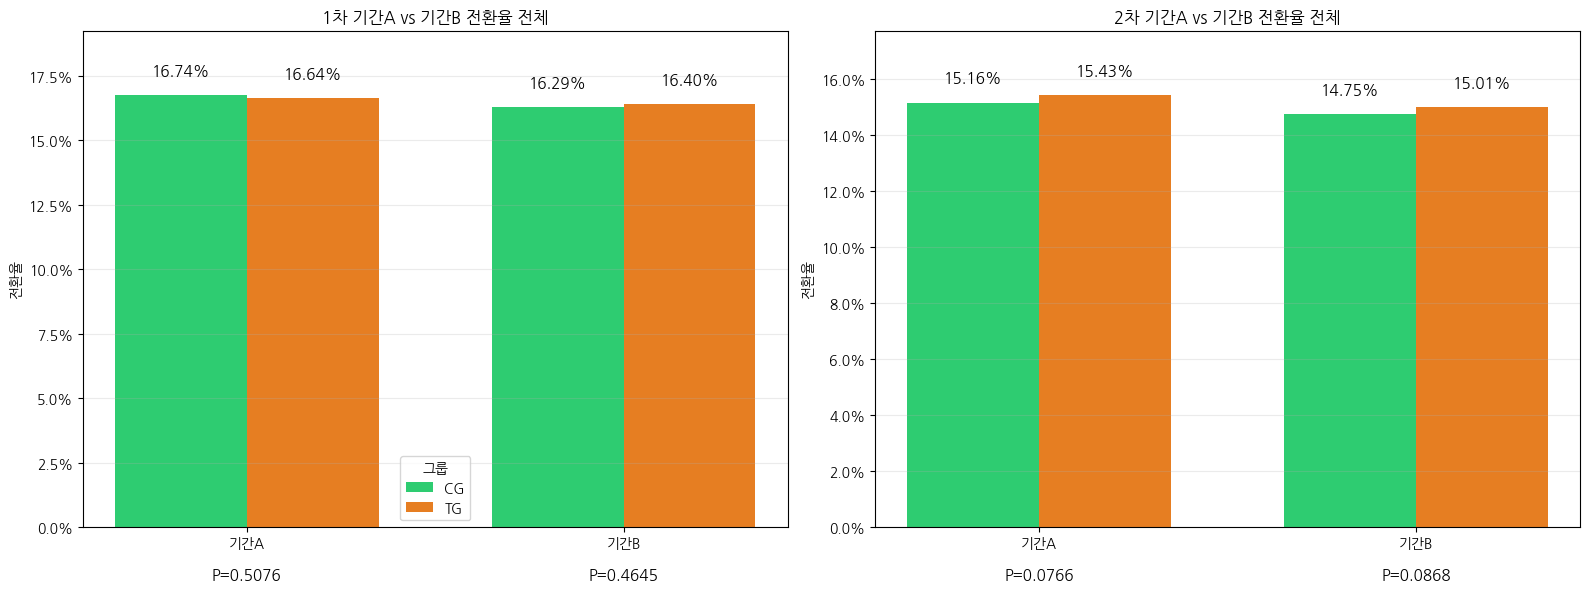
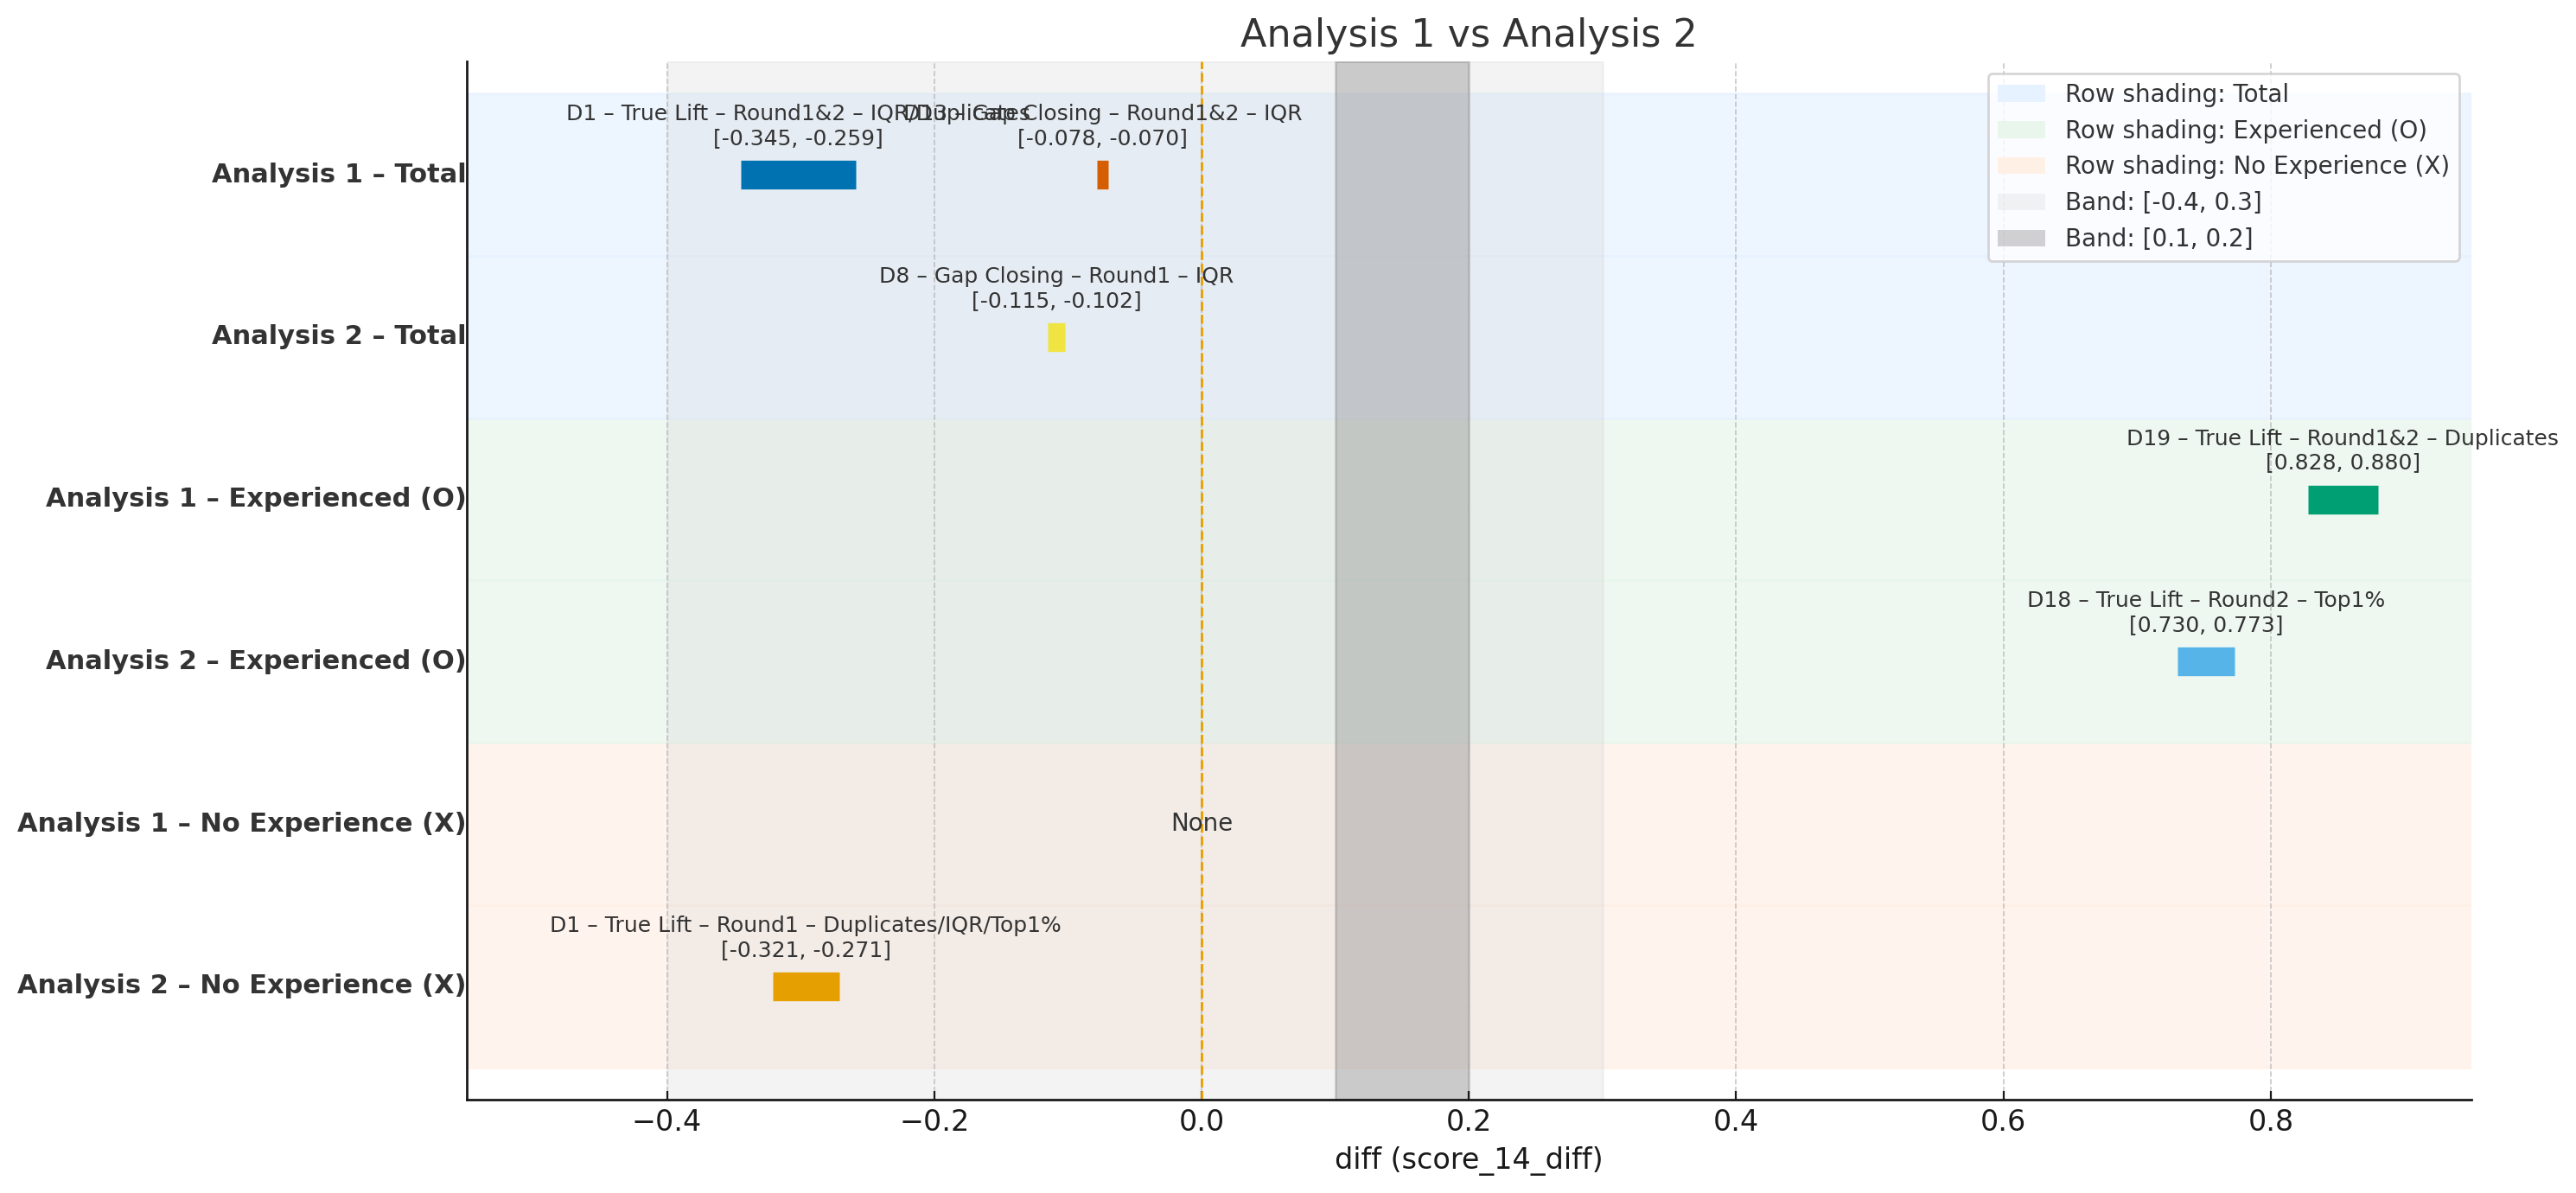
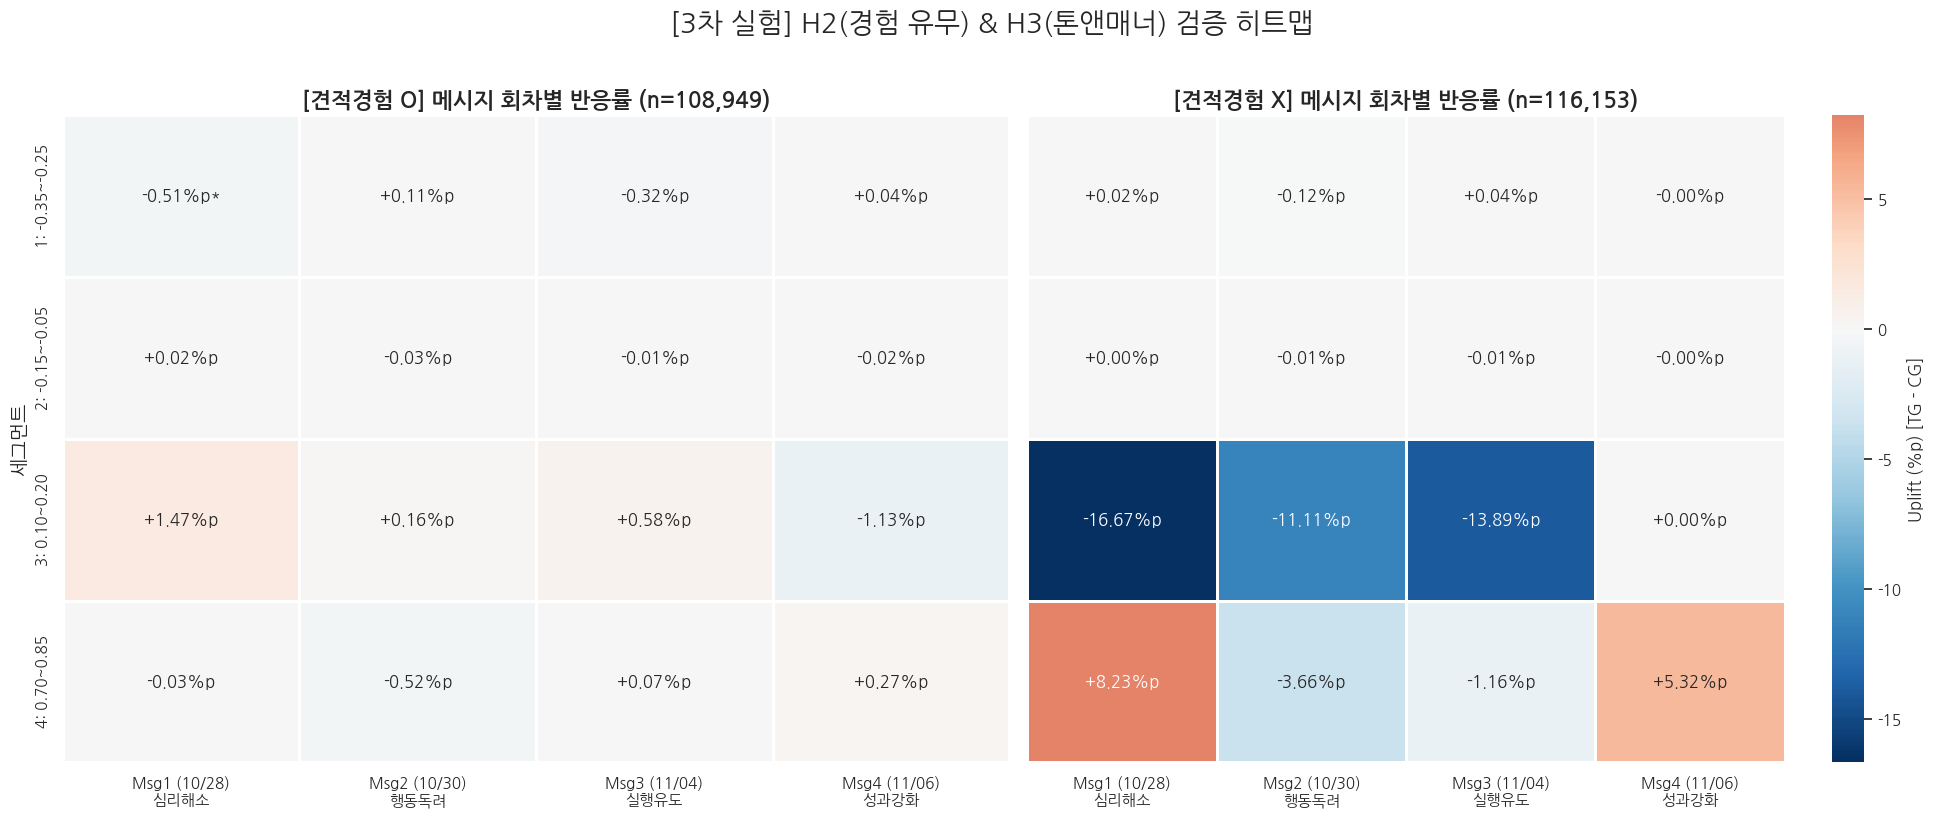
To design a structure connecting the derived prediction scores into actual CRM experiments, I collaborated with the DataOps team to load model extraction results into BigQuery, linked the necessary experiment variables to Braze user attributes, and built a pipeline enabling message experiments in Braze Canvas by segmenting based on the probability change score compared to service average (`score_14_diff`). While the effect was diluted in the overall average, uplift by segment was repeatedly confirmed when broken down by score_14_diff and behavioral experience. This confirmed that even for the same provider, the required intervention purpose and message tone differ based on state and experience — and we are currently exploring extending this into an operational structure that automatically branches messages and timing based on score and behavioral context.
Round 1 — Overall Average
Rounds 1 & 2 — Response Pattern by Segment
Round 3 — Score Segment × Quote Experience Status
Figure — Rounds 1, 2 & 3 Experiment Results: Message Response Comparison by score_14_diff Segment and Quote Experience
05
RESULT
Improved the Conversion Structure Leading to Repeat Behavior After First Payment
When the reasons providers stop differ, even the same message works differently. In this project, barriers were classified by type, and the exposure timing and messages tailored to each barrier were designed to improve conversion in the repeat behavior stage.
Even in the prediction model experiment, rather than judging effectiveness from the overall average alone, I first looked at under what conditions differences appeared. Just as a question that started with a survey led to a modal experiment and then a guide chat room, an experiment that discovers the conditions under which differences occur is not a failure but a learning that shapes the design of the next experiment.
This was a project that first identified where users were stopping, then designed more precise messages for those points to improve conversion.
Soomgo Plus ad product — New feature GTM & monetization
01
OPPORTUNITY
Designed Pre-Launch Demand First to Ensure New Monetization Features Led to Real Payments
As efforts to expand the platform's overall monetization structure continued, new monetization features that providers could directly utilize were introduced in addition to the existing business model. My role was to lead the marketing strategy and execution to ensure these features weren't just launched, but were clearly communicated to providers and led to actual usage.
02
Business Objective
Business Objective
The core objective was to increase bid amounts for ad products and expand provider revenue contribution.
03
STRATEGY
Rather Than Focusing on Post-Launch Spread, I First Designed a Structure to Validate and Capture Pre-Launch Demand.
I started by narrowing the target. Analyzing provider revenue and activity data in BigQuery, I defined the core target segment for the ad product in SQL based on monthly revenue range, category, and repurchase patterns, then designed a demand validation and pre-demand capture strategy centered on that group.
04
EXECUTION
Round 1 Goal Achievement Rate
109%
Target Bid Amount Exceeded
Contribution Share of Open-Alert Opt-In Users
53%
Proportion of Opt-In Users Among Actual Bidding Slots
Figure — Pre-launch demand captured through the open-alert signup event converted into actual bidding results
※ At the time, Soomgo Plus operated under the name 'Top Fixed Ad', with winning bidders confirmed after a 2-week bidding period. Currently, the bidding mechanism remains but has been updated so providers bid using their held cash, and existing payments are automatically cancelled when a higher bidder appears.
I built an operational structure that minimized engineering resources while rapidly collecting sign-up intent and reconnecting at the launch moment.
Leading the open-alert signup event, I focused on building a structure that could be experimented with quickly from planning. Using Braze custom attributes, I collected sign-up intent without additional engineering and built a structure where automatic notifications were sent at launch.
Open-Alert Signup Operational Structure
Event Page Modal Display
→
'Yes' Click
→
Braze Custom Attribute Set
→
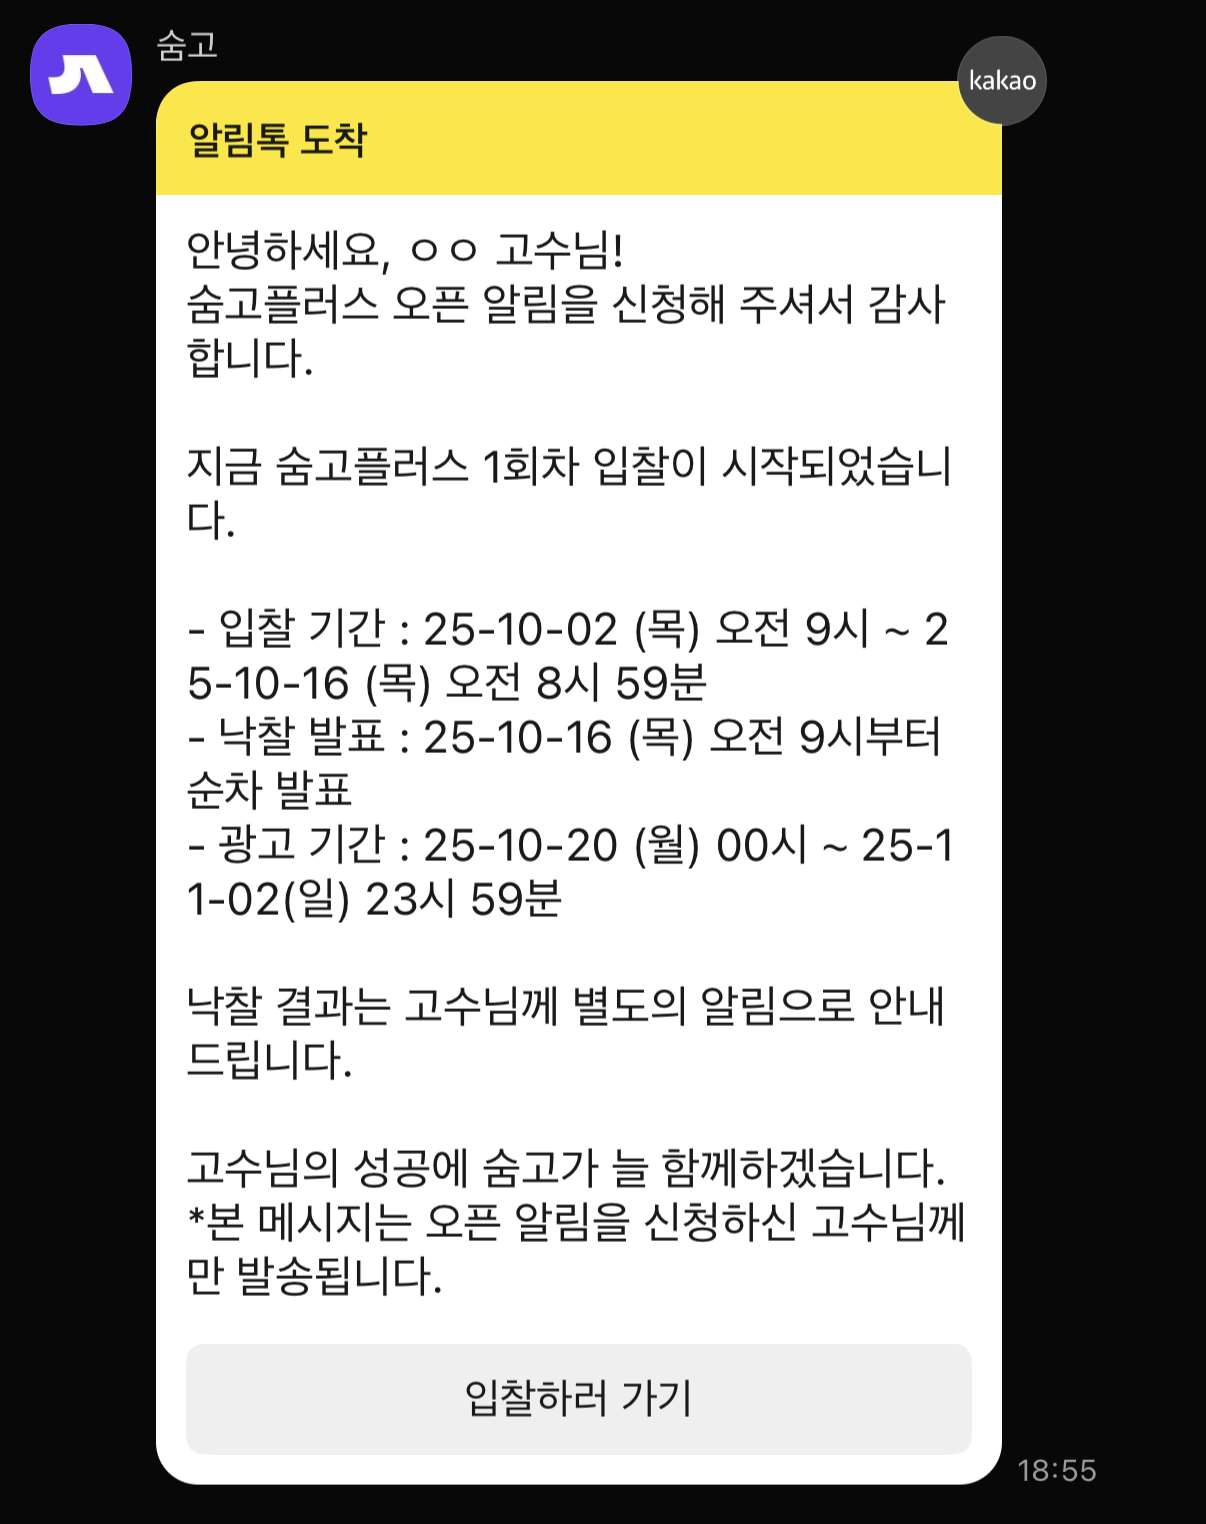
Auto KakaoTalk Notification on Launch
→
Actual Bid
Figure — Open-alert signup operational structure built using Braze without additional engineering
Code for setting custom attribute when 'Yes' is clicked on the open-alert signup modal
Designed using Braze without additional engineering to collect sign-up intent and track subsequent bidding behavior.
Capturing initial demand using event page and in-app modal
Driving actual bidding behavior through in-app and KakaoTalk notifications at launch
Figure — Soomgo Plus open-alert signup event and operational communications
Through repeated segment × value proposition experiments, I subsequently built a message pipeline combining service and regional data to automatically reflect market-type USPs. To do this, I directly created a marketing table in SQL combining service, regional, and provider characteristic data, and designed a structure using Braze Connected Content to call that data at message send time.
Representative Automated Message Examples
Growth Opportunity Market
“⏳ $[Region]$ $[Service]$ peak season growth opportunity! With fewer bids right now, secure your first customers for just ₩800/day.”
Direct Request Expansion Market
“🎯 $[Region]$ $[Service]$ is a market top providers are watching! Use peak season ads to grow direct requests and have customers seek you out.”
Competitive Defense Market
“🚀 $[Region]$ $[Service]$ is hitting peak season maximum requests! Competition is fierce. Advertise now to grow direct requests and protect your peak season revenue.”
Efficiency-Focused Market
“☄️ Capture the $[Region]$ $[Service]$ peak season demand surge! Run efficient ads from just ₩800/day minimum to capture all requests!”
The same product was communicated with different USPs based on market type and provider characteristics.
05
RESULT
Built the initial communication structure without engineering and strengthened message impact through segment refinement
Using only Braze — without additional engineering — I built the open-alert opt-in and automated send structure, enabling fast and stable initial communication operations. After the payment model shifted to immediate payment, CRM message attribution expanded significantly. Post-refund attribution rose from an average of 16.9% in rounds 1–5 to an average of 58.5% in rounds 6–9, peaking at 73.2%. This demonstrated that messages were functioning as a direct conversion trigger — not just a reminder. Subscription conversion rates and post-bid repurchase changes were analyzed directly in SQL and fed back into subsequent communication and segment design improvements.
※ Detailed figures and analysis data related to ad slots, bidders, and winning bidders are confidential; this document covers only the structure and key insights.
Retrospective
Faster Experiments, More Fundamental Questions, and Clues That Open the Next Experiment
01
Rethinking CRM as an Experimentation Channel
Marketing is typically seen as responsible for execution at the final stage of the funnel, but at Soomgo it was possible to extend this role further upstream — discovering and validating problems earlier. Working on provider communication strategy and looking at user research alongside funnel data, I began to see where providers were actually getting stuck and what they found difficult. And rather than waiting for the product development cycle, these problems could be tested as hypotheses and experimented with faster using Braze. Through this experience, I learned that CRM can be not just a channel for sending messages, but an experimentation channel that tests user problems most rapidly and builds the case for product improvement. Working with data scientists, analysts, and UX researchers, I also experienced how each discipline interprets the same problem differently — and came to see more clearly that connecting those differences into a single execution structure is an important role of the marketer.
02
Looking at Fundamental Problems Before Short-Term Conversion
Through repeated exposure to user research, the more fundamental question kept coming back to: “Are we properly delivering the information users need?” For providers, Soomgo was a far more complex platform than expected, and the amount of information to understand and decisions to make before reaching a first transaction was greater than anticipated. On the surface it looked like a conversion rate problem, but in reality the gap between the information the platform provided and the information users needed was blocking action. Through this experience, I learned that creating a structure where users can understand and make decisions is a more fundamental task than optimizing the short-term funnel. Experiments ultimately confirmed that conversion problems may not be persuasion problems, but problems of information structure and comprehensibility.
03
Experiments That Leave the Next Question More Than the Result
Not every experiment ended with a clear win or loss, but even results with no significant difference became clues that changed the design of the next experiment. While the effect was blurry in the overall average, response differences were clearly visible in specific segments — and those differences became the basis for requiring more precise message design. Through this process, I came to see the value of experiments differently. What mattered was not dividing success and failure by a single result, but discovering under what conditions responses change and sharpening the next question. This led me to see experiments without clear conclusions not as reasons to stop, but as starting points for the next design.